Earl's PseudoVolume Indicator displays relative volume for each bar of a tick chart, making anomalous activity spikes much easier to spot. Trade with more confidence and without wasting time checking a time-based chart whenever you get an entry signal and suspect anomalous activity.
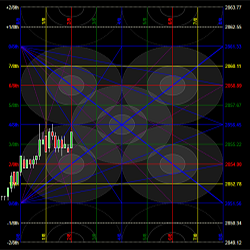
Samri Math RY Intraday is a purely PRICE-based indicator for traders who use Murrey Math methodologies. It works not just with time-based charts (day/minute/second), but also with other chart types such as Renko, Range, Volume and Tick. Multiple algorithms for calculating price levels are included.
TradeZella is an advanced trade journaling and analytics platform that helps traders track and optimize performance. With auto-sync from NinjaTrader and Tradovate, in-depth analytics, advanced backtesting, and AI insights, traders can find their trading edge.
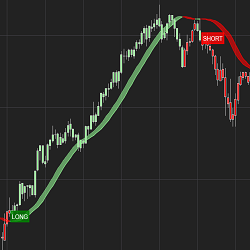
The HolyGrail Algo uses calculations of the Hull Exponential Moving Average to identify market direction. A long or short condition is printed on the chart and the strategy executes the trade by going long or short. You can set defined take profit, stop loss and trail and time of day to trade.
Experience trading evolution with our automated bot! Powered by a dynamic trailing trend system, it adapts to market shifts for optimal entries and exits. Elevate your strategy now!
The Arnaud Legoux Moving Average (ALMA) is a powerful technical indicator designed to improve the accuracy of moving average calculations. ALMA indicator is an advanced variation of traditional moving averages that aims to reduce lag and noise while providing better responsiveness to market changes.
VWAP Algo uses VWAP for precise trades, minimizing market impact. With Anchored VWAP and Renko/Range Bar charts, it optimizes entries/exits and risk management. Requires expertise and robust systems. Ideal for liquid markets, it’s a key tool for traders seeking efficiency and precision.
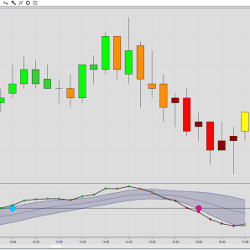
The MACD BB Lines indicator is built from a standard MACD indicator with Bollinger Bands added to the signal line. The MACD values are shown as dots. During an up/down-trend the MACD dots will print above/below the upper Bollinger Band.
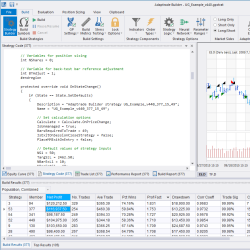
Developing automated trading strategies can be time consuming and difficult. Adaptrade Builder is an advanced trading strategy generator that will quickly find, code and test unique and complete trading strategies based on your requirements. Start building strategies today with a free 30-day trial!
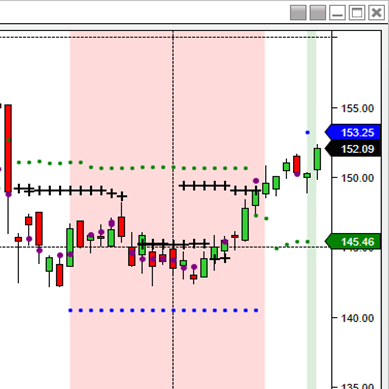
The iMTF® Ichimoku indicator features multi time frame support/resistance levels using crosses (long term) and purple dots (short term). Cloud breakouts are represented by green and red shaded areas to identify buy and short sale zones after an instrument has broken out of the cloud.
June 24, 2025
“New Order Block” Hack Using Level 2 Market Depth and Liquidity
June 10, 2025
Single Print Trading
June 3, 2025
The Trump Card: Tariffs and Trade Wars
Enter Email for Updates