Volume Sliver - by TREMPER.com
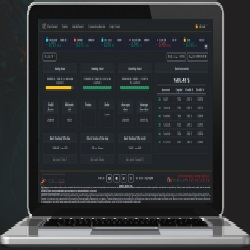
Easy Duplicator - by Ocean Trading Indicators
Join our live trade room for Day Trading the NQ and ES Futures! - by Trade With Steven

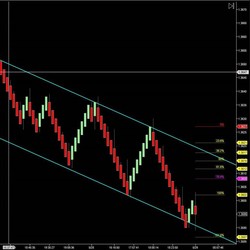
DTB Auto Fib Auto Trend - by Dynamic Trading Bars
Trade With Me - by Trade With Me
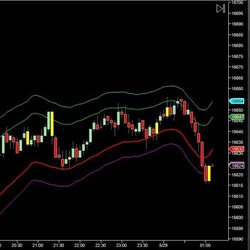
DTB Ultimate Bands - by Dynamic Trading Bars
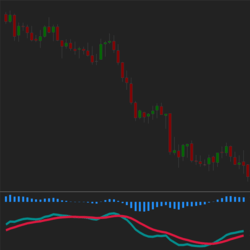
MACD Crossover Strategy - by FrostMist
How to Become the Casino eBook - by ChartPros