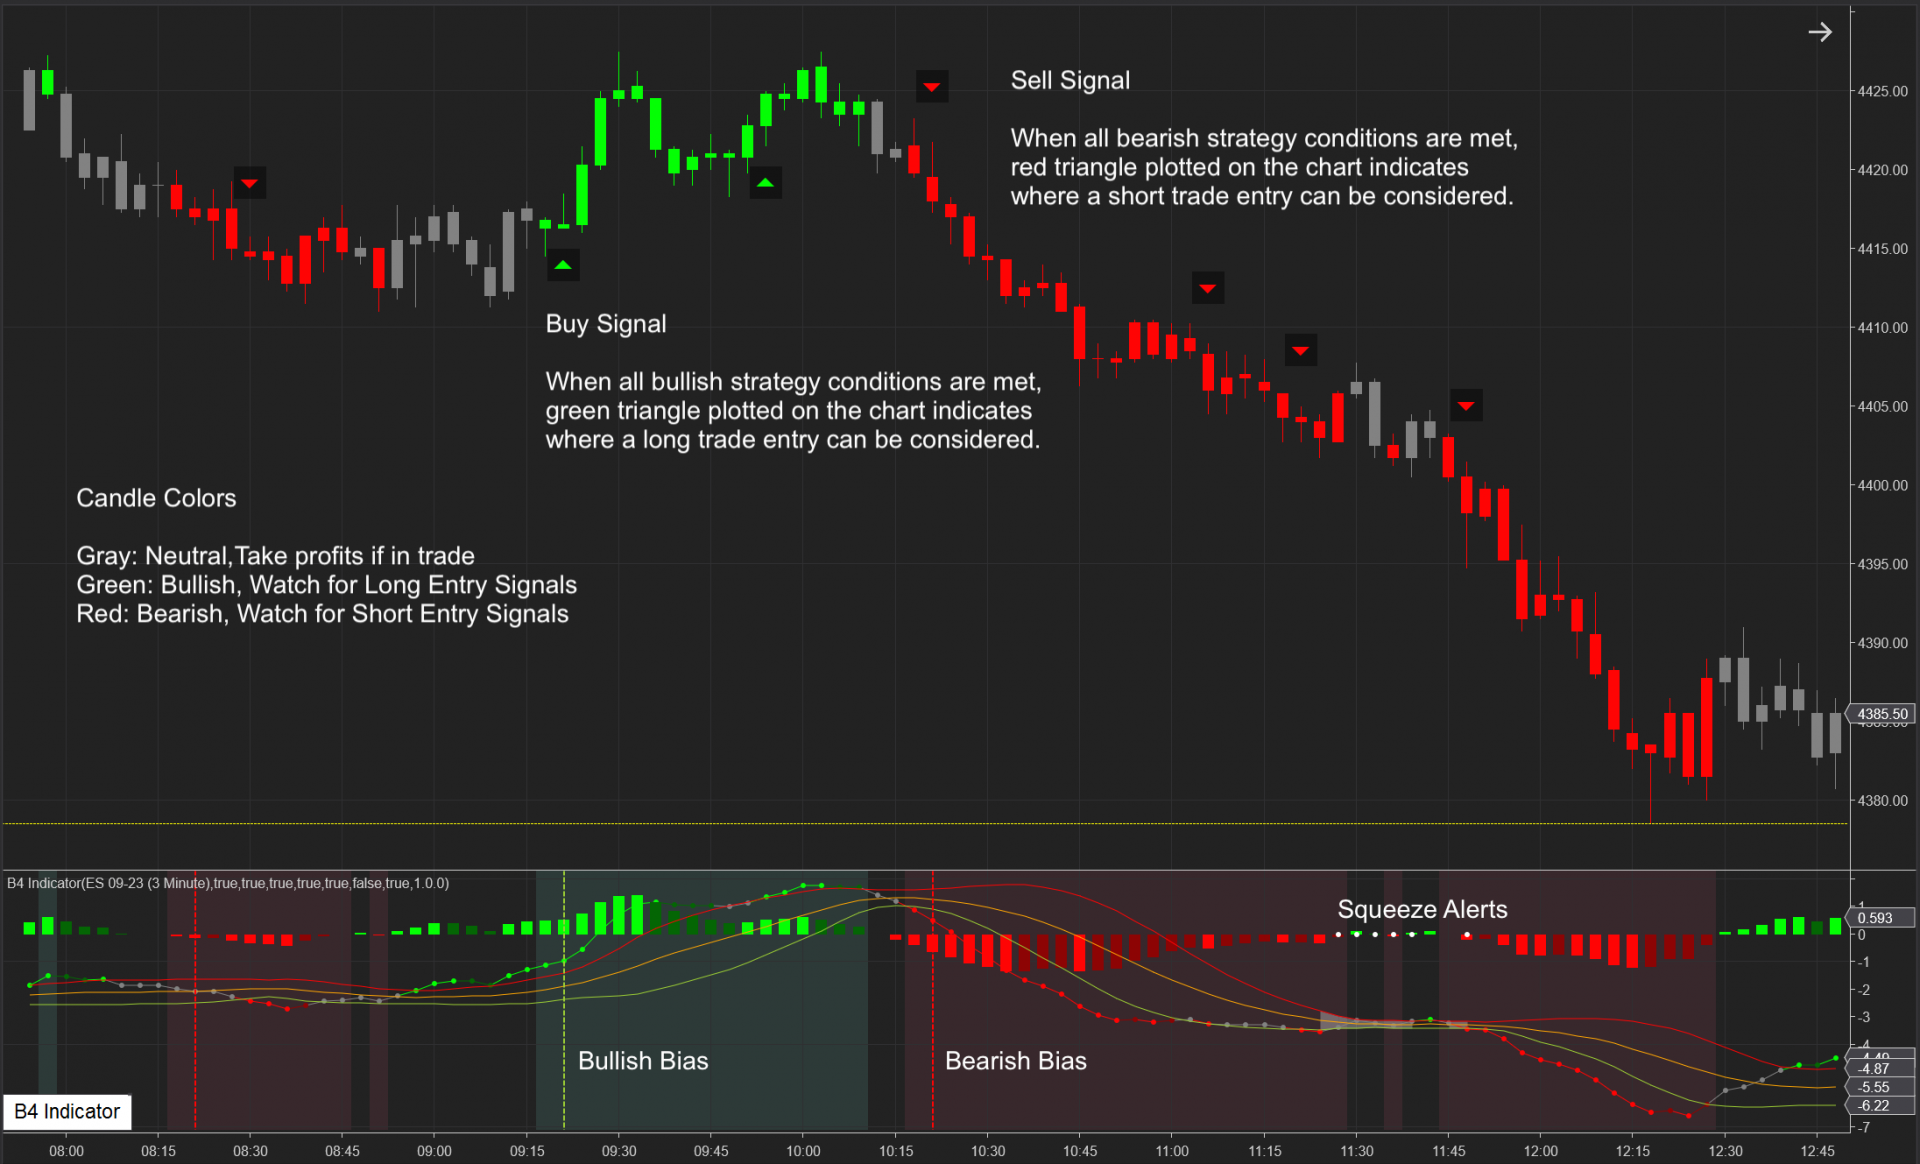
B4 Indicator is a trend and momentum indicator with buy and sell signals. Indicator background color shows the trend bias. Vertical lines show the trend confirmation. When all conditions are met, buy and sell signals are plotted on the chart. It also includes capabilities to detect market squeezes.
The Divergence Indicator offers combinations of single, double, and hidden divergence displays. Divergence measured is price action compared against a selectable NinjaTrader indicator. The selection list includes TRIX, RSI, CCI, RVI, MACD, TSI & more. Get a free trial now!
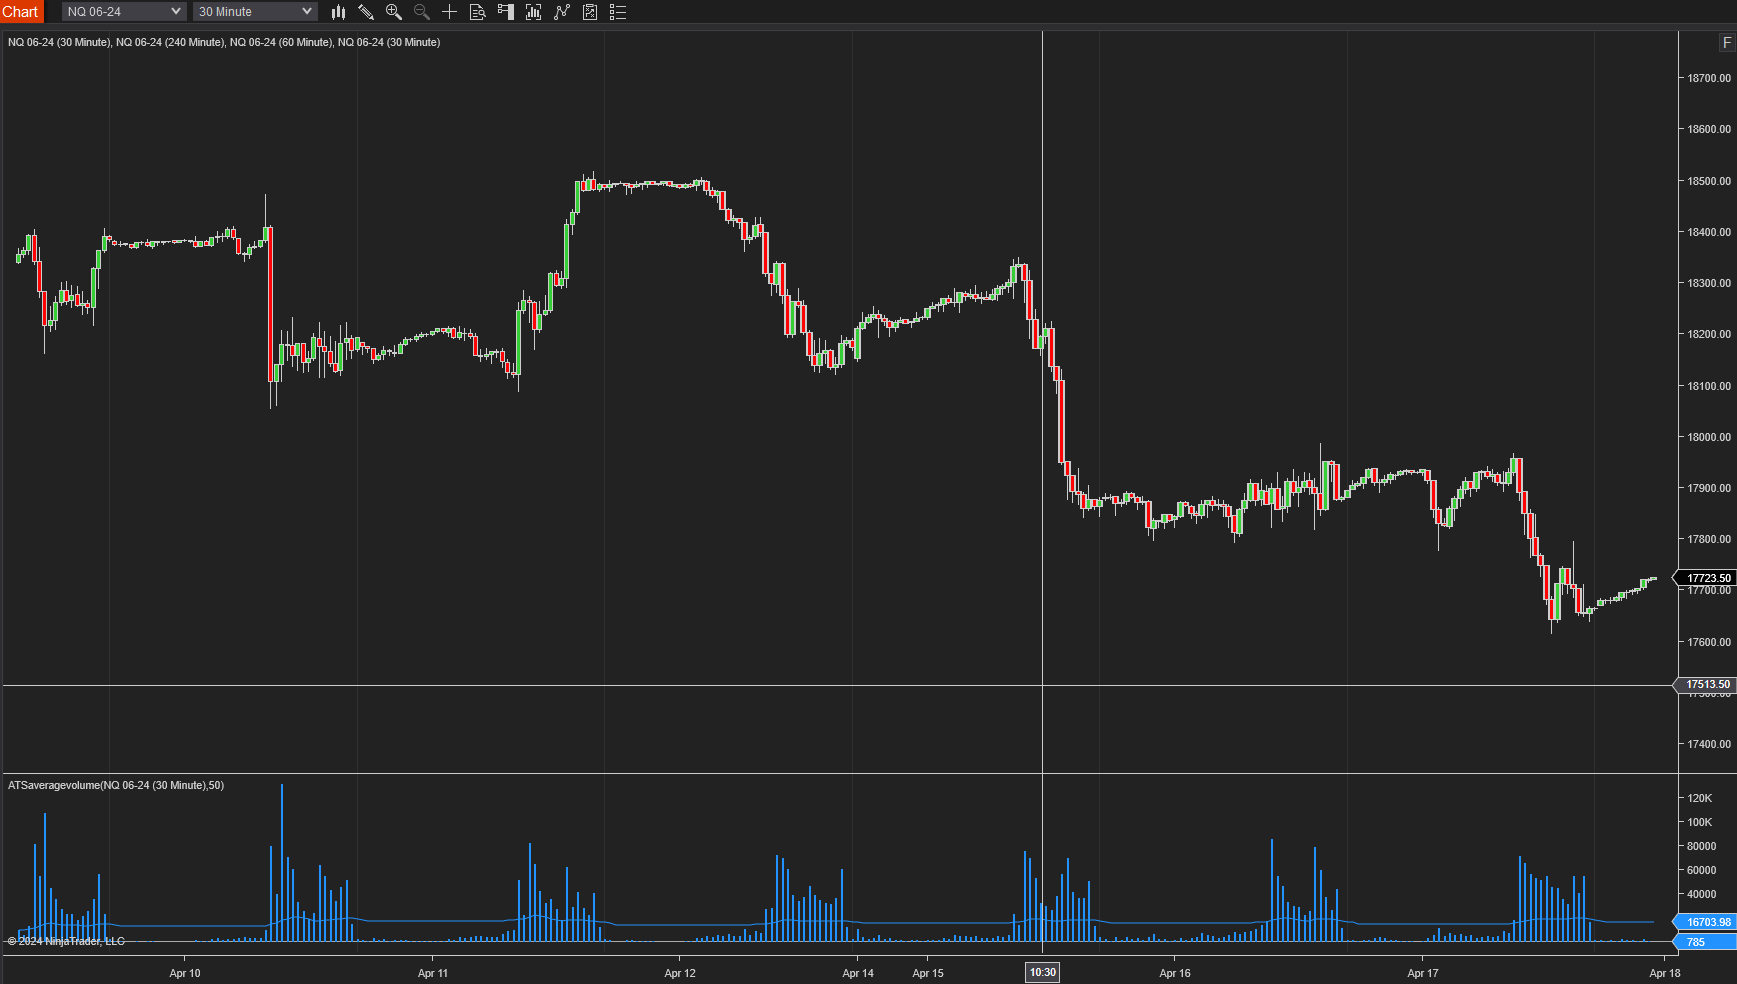
This indicator plots a 50-bar average of the volume overlaid on the current volume. You can change the number of bars used to calculate the average.
Q-GZone provides visual gap zones between the bars. Gaps occur when a significant imbalance exists between buy and sell orders. It can lead to a gap in the price as the market seeks to match these orders. The market tends to return to and fill in these gaps.
TradeFoxx is an automated trading software designed for the NinjaTrader Desktop platform, version 8. It supports trading in Forex, Futures, and Equities, and offers full automation with time frame control. A free 30-day trial is available, allowing you to test the product before making a purchase.
We provide traders with an opportunity to earn live funding based on their trading performance in simulated accounts.
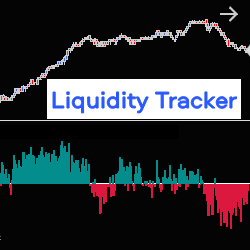
The Liquidity Tracker allows you to monitor, in real time, liquidity variations in the Order Book (pending orders at Bid & Ask), on one or two correlated instruments, at the same time. It therefore allows you to follow the evolution of the market based on the strength of supply or demand.
The MCumulativeDelta Indicator shows the bid / ask volume displayed in a histogram over a period. It serves to determine whether supply or demand is dominating and in control and the buying / selling pressure.
Free trading psychology masterclass. Learn the complete trading psychology system to overcome destructive trading habits and reach pro-level consistency in as little as 8 weeks (even if you are starting with zero willpower and breaking your rules every time you trade). Register today!
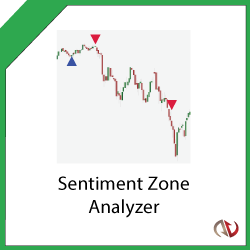
Use the Sentiment Zone Analyzer to measure overall market sentiment to spot trend reversals early! Based on the premise that extremely bullish or bearish tendencies will eventually lead to trend reversals. Dynamically calculates overbought and oversold levels based on previous price action.
July 8, 2025
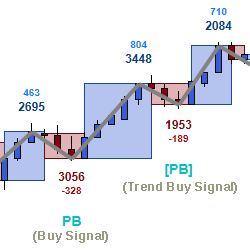
New Easy Continuator Signal: Pullback Entry With Trend
June 24, 2025
“New Order Block” Hack Using Level 2 Market Depth and Liquidity
June 10, 2025
Single Print Trading
Enter Email for Updates