LH Dynamics System is an advanced trading tool that combines state-of-the-art algorithmic technology with real-time quantitative market analysis. Its flexible design allows it to be used in fully automated mode or in semi-automatic mode.
KJD Capital AutoScalper is an automated strategy delivering structured buy and sell signals with built-in trade automation. The integrated UI allows traders to toggle automation, enable/disable longs or shorts, and maintain disciplined execution.
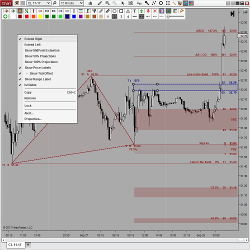
DrawBar Ultimate takes manual drawing, styling and chart analysis to the next level! It contains hundreds of options and 13 custom drawing tools including Volume Profile. All have multiple extensions, labeling, unique right click context menus, one click template switching and more.
This indicator uses the simple idea of momentum reversal and identifies an entry or exit position. It also shows if the market is sideways or trending. Wizard was named after a trader who was nicknamed “The Wizard” for the use he got out of this algo.
Streamline trade execution with easy one-click on-chart or button-based order placement with ATM trade management. Supports Stop Market, Stop Limit, Limit, and MIT order types, including OCO bracketed orders, for directional or bidirectional trading.
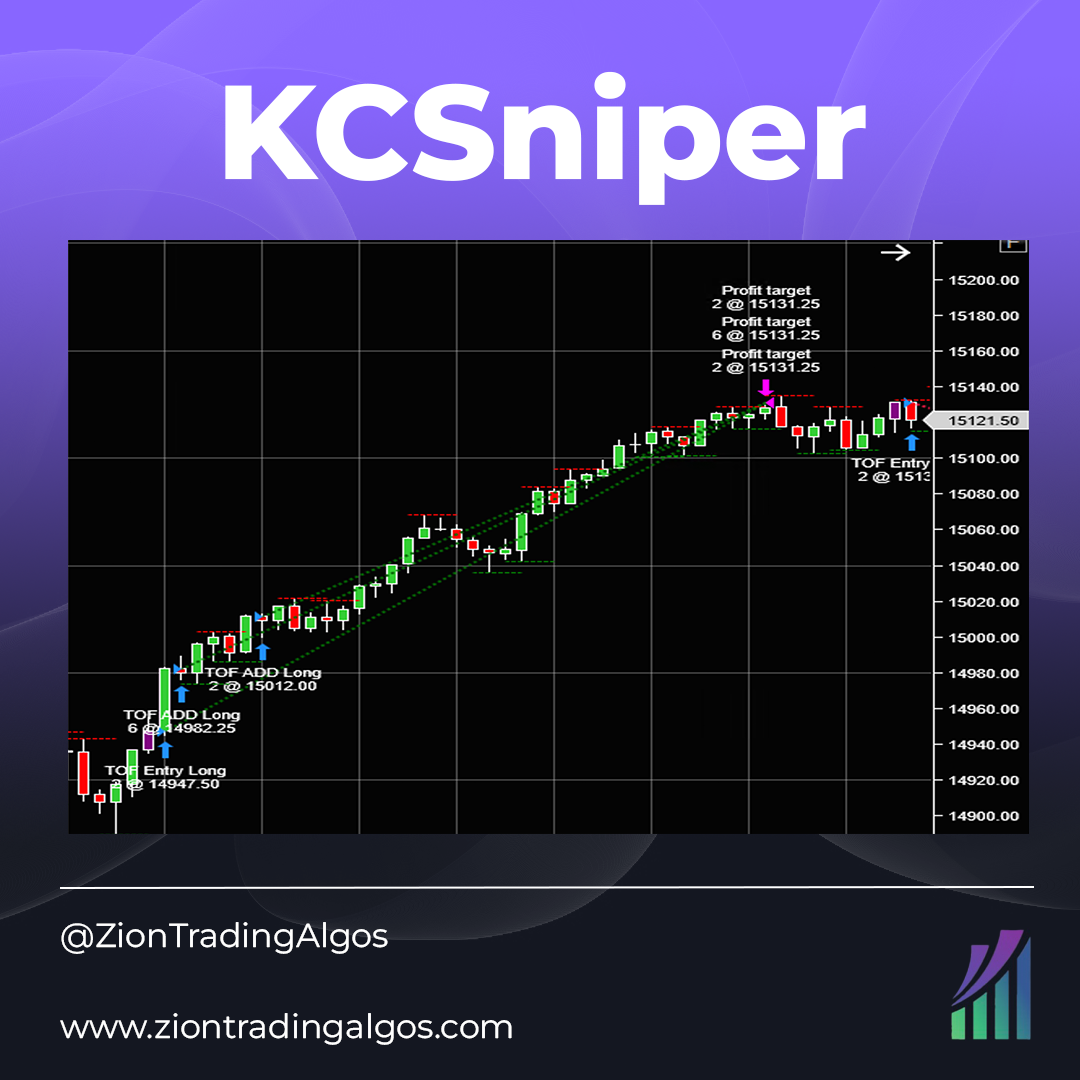
KCSniper is a Keltner Channel-based system on the 10-minute chart. It is long only and does not pyramid into positions, but has a single entry and exit model. It uses volatility based stop loss and take profit targets to remain adaptable. Trades MES and MNQ.
Bell R-Delta Alert provides a 360 degree microscopic view of the markets and is particularly designed for Scalpers, Intraday and short term players. The Bell R-Delta features onscreen, audio and email alerts!
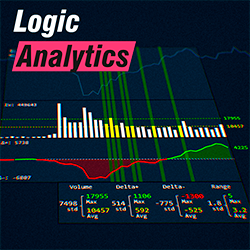
Visualize the relationship between delta and volume with accurate statistical calculations on delta, ask, bid, and volume. This tool combines the power of data analysis with advanced charting, allowing you to see the most relevant market movements.
The VWAP Pack includes a VWAP Indicator with current and previous levels, a Price to VWAP indicator to output the position of price, and a Market Analyzer template! With the Price to VWAP indicator, it is easy to monitor the position of price in relation to the current VWAP.
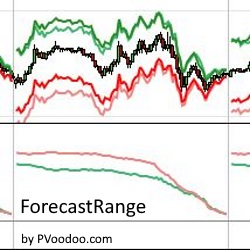
The PVForecastRange indicator calculates price moves and sets targets based on previous days’ statistical volatility. Try it for free!
April 20, 2026
Your Optimal Strategy Already Exists
April 14, 2026
Top 3 Automated Setup Strategies: Simple and Straightforward
April 7, 2026
Why Order Flow Isn’t Enough
Enter Email for Updates