Transform your trading! Analyze your stats, understand your account management and get AI-powered analysis of your trades to pinpoint exactly where you can improve your strategy and performance.
Developed by Institutional Traders, our time-tested, award-winning, strategic or manual trading software provides real-time Buy and Sell signals across all markets. Please visit us at www.powerballtrading.com
The algorithm executes trades based on previously designed and projected levels from previous day to the next, providing a clear and predictable market structure and the trade it will be able to perform.
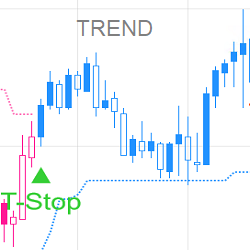
This strategy is a trailing stop indicator turned into a fully automated strategy on "autopilot" that manages trades from open to close. Follow the trend on any time frame of your choice - available as lifetime purchase or monthly lease.
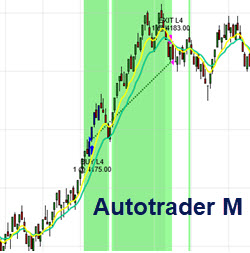
The AuToTrader M is an automated system for highly active traders willing to conservatively trade high-volatility future instrument (CL, ES, YM, etc.)The system comes w/ BACKGROUND M to track positions, a powerful money management module to protect profit & principal.Lease includes training, support
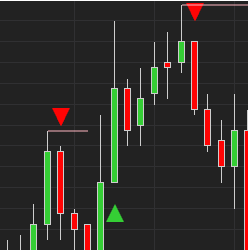
New "Ultimate A.I." indicator has it all: buy and sell signals, trend reversal signals, scalping signals, pullback alerts and stop loss placement lines. It’s multiple systems all in one. Learn more! Watch a demo tutorial by clicking the link! We also have a private chat group. Get a 5 day trial!
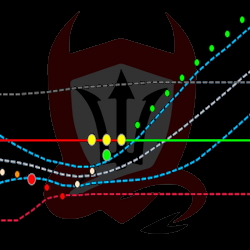
TradeDevils Indicators offers unique indicators for NinjaTrader 8. Regardless of whether you are a scalper, a trend follower or a breakout trader, they can provide you with the right indicators to assist with your trading.
Gamma Capture is an intraday volatility measure. It is an indispensable Technical Analysis indicator for traders looking to identify potential trading opportunities, such as entry-exit levels based on breakout moves. Gamma Capture Bands are more stable and accurate than Bollinger Bands for intraday
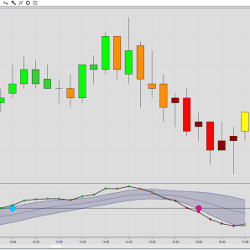
The MACD BB Lines indicator is built from a standard MACD indicator with Bollinger Bands added to the signal line. The MACD values are shown as dots. During an up/down-trend the MACD dots will print above/below the upper Bollinger Band.
This self-paced course covers everything you need to know about using Visual Studio and NinjaTrader 8 together: installation, organizing code, source control, projects, assemblies, 3rd party code, NuGet packages, debugging and more. We offer a 30-day money back guarantee. Click to learn more!
April 7, 2026
Why Order Flow Isn’t Enough
March 31, 2026
Candlestick Patterns in Adaptive Markets
March 25, 2026
Day Trading With The iNewton Automated Trading System 2026
Enter Email for Updates