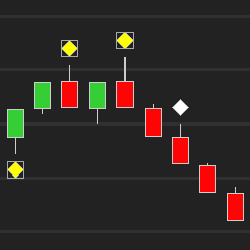
This tool and indicator helps you spot trigger entries with such features as one 4-range and one 14-range data series chart and one indicator. It's a simple, clean and very effective price-retrace system. Follow EdsRetracePlan to learn exactly when and where to buy or sell on price retraces.
NQ Ultra is a fully automated futures trading system for NinjaTrader 8 with built-in presets for NQ and Gold (GC). Adaptive trend logic, smart risk controls, and fast execution give traders a data-driven edge.⚠️ Futures trading involves significant risk of loss.
The J-Bot / Prance Strategy is an automated trading strategy for NinjaTrader. It utilizes machine learning models, technical indicators, and price action analysis to identify potential trading opportunities and adapt to changing market conditions through rule-based decision making.
Trading OrderFlow delivers your ideas: your imagined automated strategy, semi-automated strategy or custom indicator. Turn your concept into an elegant solution adapted to your trading style and needs. Contact them about your development project for specialized service and expertise!
The Candlestick Express Class is the simple way to learn candlestick patterns and strategies. Traders quickly learn to combine candlesticks, Western technical signals, and trade management strategies. These techniques are useful in Forex or any other market. Get instant access when you register!
Become a full access member to all of thei exciting services. Membership includes: Trade room access, software activation for up two computers, and thei Daily Market Movers trade reports.
Using Renko/range/tick/volume bars? Optimal Speed analyses the length of time a bar took to form in order to highlight possible congestion areas. Instantly see the slowest bar of the session, slower-than-average bars, crawl bars and the slowest up and down bars of the day. Strategy compatible.
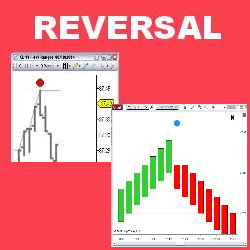
This indicator detects possible reversal bars using Stochastic overbought & oversold conditions & paints entry signals in real time. The Stochastic levels are fully customizable & each reversal signal features a horizontal Reversal Breakout Order line marking sell stop entry levels. Try today!
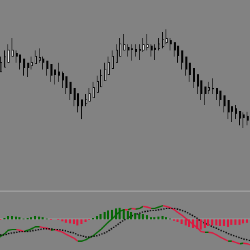
The EPyFMACD indicator has additional functionality such as Cross Color and UpDown, increasing the amount of visual information conveyed. The color and thickness of the EPyFMACD can also be customized.
Performs real-time analysis of the volume and price trends to color the lower panel of the chart with actionable information. When both are trending in the opposite direction, the panel will be colored purple to mark this "unusual behavior." Start using this key Information in your trade plan today!
April 20, 2026
Your Optimal Strategy Already Exists
April 14, 2026
Top 3 Automated Setup Strategies: Simple and Straightforward
April 7, 2026
Why Order Flow Isn’t Enough
Enter Email for Updates