No need to stare at the chart and wonder or make guesses - the Raptor will tell you! The Raptor detects potential trades for you out of the box and will alert you when these trades are setting up. This gives you plenty of time to get into the market with zero stress.
TTT Range Indicator plots the data from the TTT E-book directly on NinjaTrader Charts. Determine the range of an instrument prior to potential reversals, and the average once the high and low for the day is recorded. Learn more!
CB RangeLevels 2.0 can be used both for support and resistance and for breakout / momentum trading. The main idea is to keep you with the trend to the upside or downside. Trade in the direction of the painted bars using the middle bars as support and resistance.
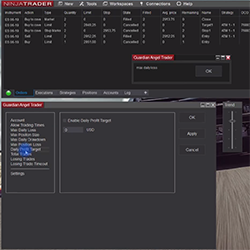
Guardian Angel Trader is a risk management tool for NinjaTrader 8 designed to help traders control trading times, max daily loss, position size, max daily drawdown, max position loss, daily profit targets, total trades, losing trades and losing trade timeout. Gain consistency in your trading!
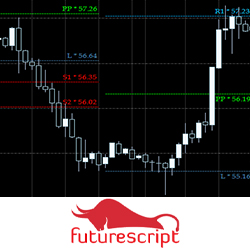
The Pivot is based on the classic pivot point indicator with a few twists and innovations. These levels present a very straightforward approach to buying and selling critical points as the session plays out using good risk/reward disciplines.
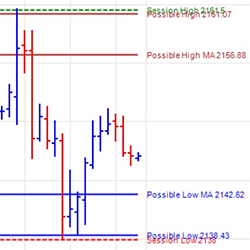
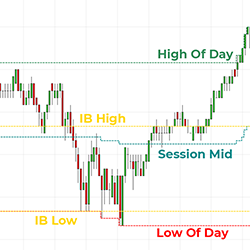
Initial balance, session mid & day mid are common market profiling levels used in day trading futures, stocks & ETF’s. This indicator automatically plots and updates these levels on any intraday chart, providing clear targets for trade entries & exits. Get started now and enhance your charts!
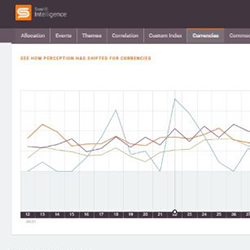
Sentifi's crypto sentiment analytics detect sentiment shifts in real time from over 500 million tweets and 2 million news and blog articles published worldwide every day. Sentifi mines this vast pool of data for investment insights to inform how market momentum is shifting ahead of price movements.
Don't miss any more targets by a few ticks with Target Zone!
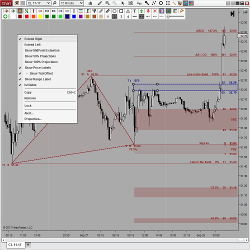
DrawBar Ultimate takes manual drawing, styling and chart analysis to the next level! It contains hundreds of options and 13 custom drawing tools including Volume Profile. All have multiple extensions, labeling, unique right click context menus, one click template switching and more.
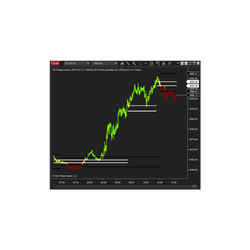
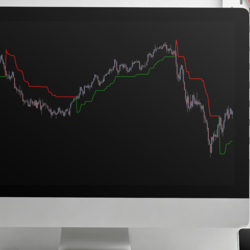
The ATR Trailing Stop is an indicator that allows you to see where to place your stop loss based on the volatility of the market you are trading (ATR - Average True Range). It intelligently tracks price movements while protecting you from normal market fluctuations.
April 7, 2026
Why Order Flow Isn’t Enough
March 31, 2026
Candlestick Patterns in Adaptive Markets
March 25, 2026
Day Trading With The iNewton Automated Trading System 2026
Enter Email for Updates
 from Indicator Warehouse.png)