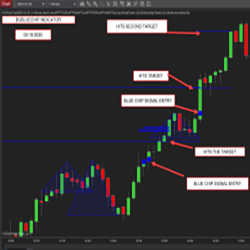
The BG BLUE CHIP clearly & accurately tells you when to enter a trade with a blue dot, and when to exit a trade with a blue horizontal line. It is that simple. The BG BLUE CHIP is one of the most popular indicators and is trusted by thousands of traders worldwide.
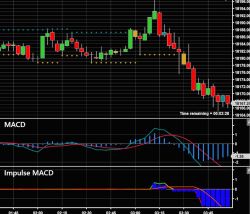
The Impulse MACD is a modified MACD that filters false signals and reduces the whipsaw in sideways markets. It helps find range bound patterns where it might be best to avoid trading and preserve capital. Simple. Don’t want to trade without a trend? Don’t trade when the Impulse MACD is flat.
Die TrendTechnik® ist ein neuer eigenständiger und in sich geschlossener Fachbereich. Mit trendtechnischen Methoden werden Tradern sowie Analysten besondere Situationen sichtbar und nutzbar, die vielen Anderen verborgen bleiben. Erfahre mehr und nutze die deutlich besseren Möglichkeiten und Chancen.
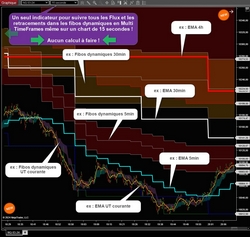
This indicator will calculate for you in multi timeframe: 4 EMA MTF + 4 “SunjoKu” MTF, the famous indicator invented by Joël Mathieu the boss of Intrad. Since version 1.5: A summary table of the status of the different TimeFrames has been included.
TradeOptima.AI is the next generation trading intelligence software for traders to embed and optimize their own automated strategies with the power of AI and machine learning. Traders receive reports that filter the probability of wins and losses—bringing AI-optimized edge to trading automation.
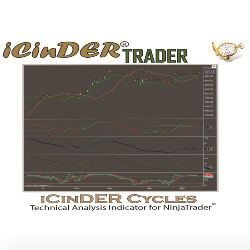
iCinDER™ Cycles indicators provide traders with the basic 3 iCinDER Cycles, Minor, Intermediate and Major. The indicators provide overbought/oversold visualization as well as visualization of bullish and bearish bias. The analysis is based on cycles of the instrument being analyzed.
To receive their free Weekly Market Movers trading schedule, just enter your email in the "" Get Free Training Video "" box. See how they schedule their trades each week as they will email you their free weekly trading schedule.
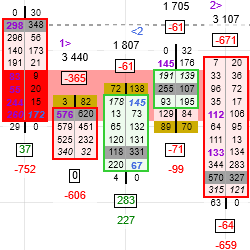
GomOrderflowPro displays the following data: sells, buys, delta & the associated calculations. It computes buy/sell imbalances & builds the associated support and resistance zones. The plots are available for building strategies or populating the Market Analyzer window. Free 2-week trial available.
By combining the Donchian Channel with an ATR Trailing Stop, this indicator provides a clear visual framework for capturing trends, spotting breakouts, and setting dynamic stop-loss levels.
Unable to find your best strategy? Automation? Click here for a free 30-minute call. SET UP helps you to build your automated strategy in order to improve it on own. Book your free appointment now.
April 7, 2026
Why Order Flow Isn’t Enough
March 31, 2026
Candlestick Patterns in Adaptive Markets
March 25, 2026
Day Trading With The iNewton Automated Trading System 2026
Enter Email for Updates