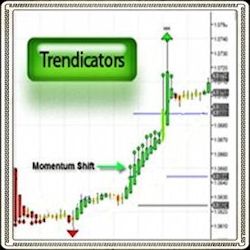
The Trendcators Indicator suite is designed to unclutter the market via built in analysis tools to pinpoint entry/exit signals with ease. It’s fully customizable providing you with the flexibility to determine which aspects of technical analysis are important for your trading! Get Started Now!
China Market Data, Order Flow
Created to help aid momentum-style charting in finding support and resistance lines. It was specifically made for the ES when plotted with tick bars. This tool may help cut down on chart preparation time or get your chart caught back up if busy multi-tasking.
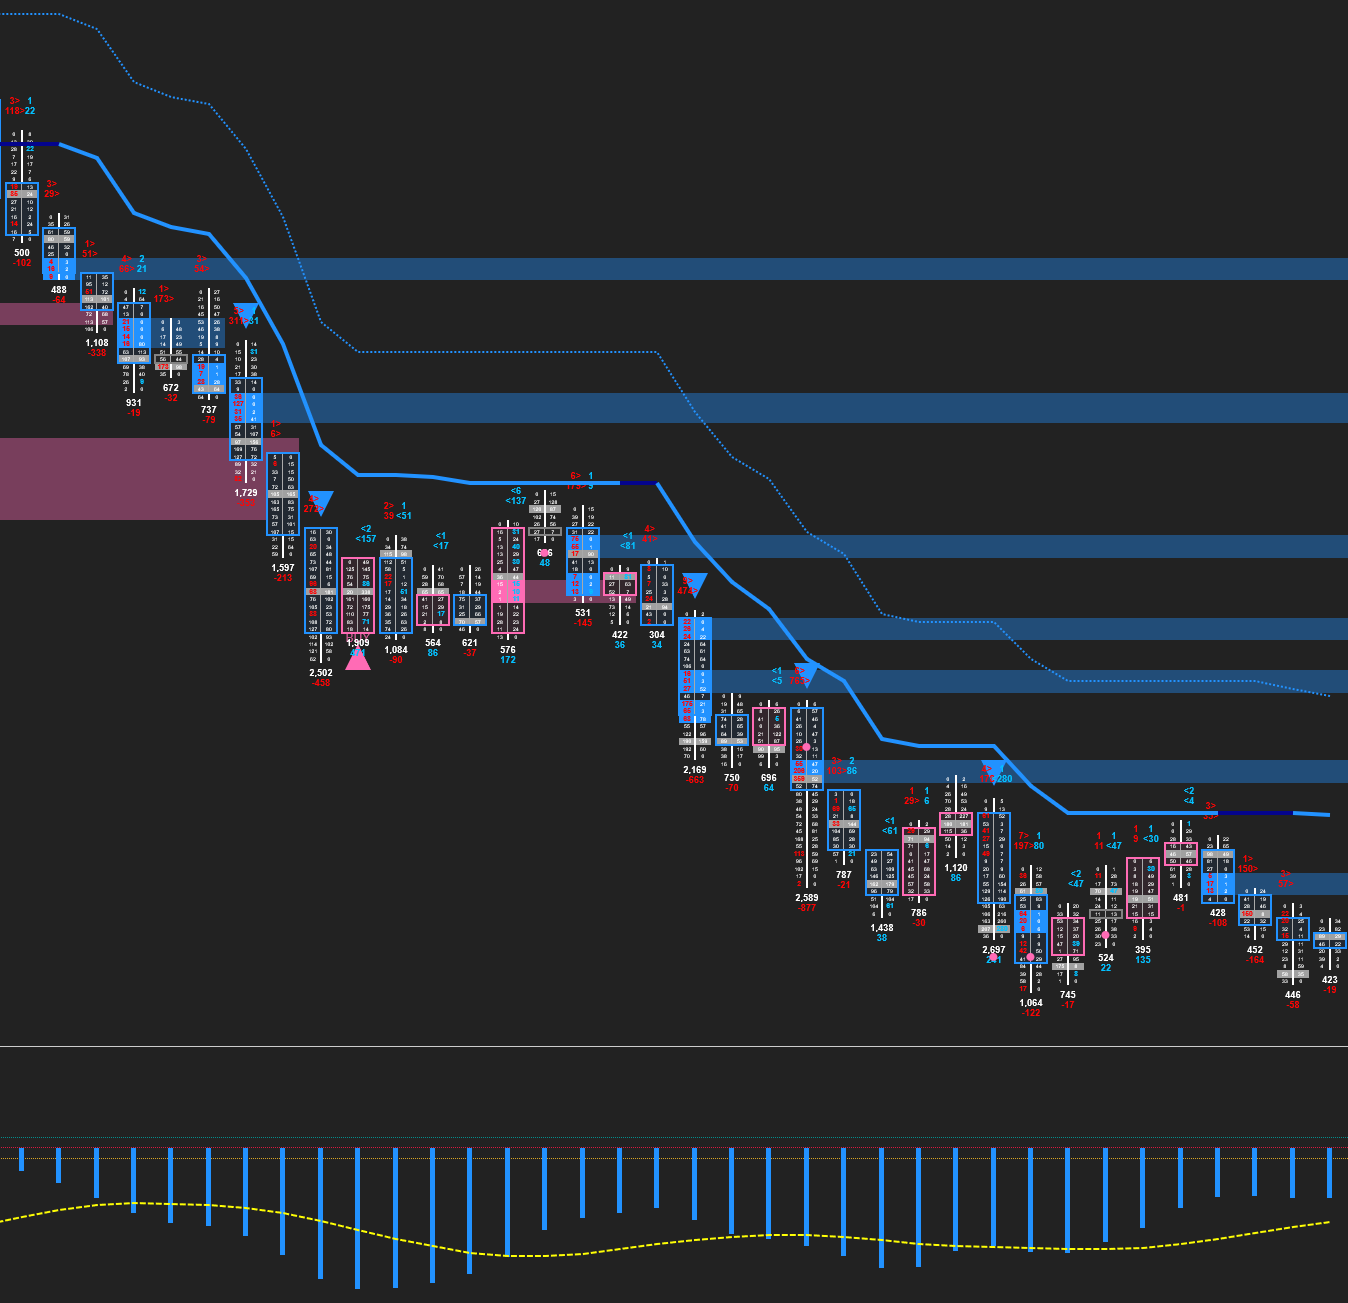
The Lighthouse Trading strategy works fully automatically in the futures market. Besides trading in different markets simultaneously, you can configure it in distinct ways in each one of them. The algorithm analyses time and sales, volume, rhythm and acceleration in real time.
MLPriceEstimator forecasts future close prices a set number of bars ahead. It adapts with rolling retraining, uses multi-timeframe inputs like price, volume, volatility, and structure context, and plots projections with optional UP/DOWN alerts for quick trade decisions.
Focused one-on-one mentorship to master session timing, spot liquidity, and identify trade opportunities using the MASADA strategy.
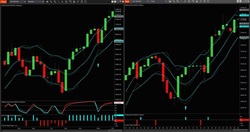
NinjaTrader offers NinjaScript (C#) for creating advanced strategies, a no-code Strategy Builder for automation, and a highly consistent backtesting engine that handles slippage, executions, fill types, and tick replay to deliver favorable results.
IATrend gives a clear indication of the trend of any financial instrument and does so on all different time frames.
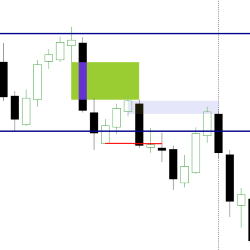
Elevate your trading strategy with the Volume Levels Indicator. Detecting support and resistance from volume, it delivers precise levels respected by the price. Features include order flow cumulative delta integration, real-time order block detection, an age counter for significance tracking & more.
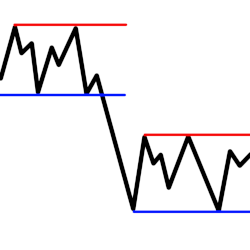
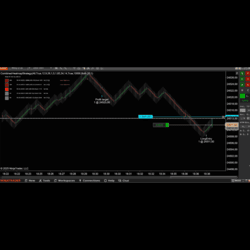
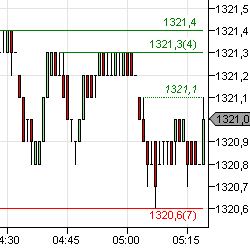
GomBang displays double/multi-top levels on the chart, with the unique ability to merge the levels from multiple charts and time-frames. For instance, if it’s displayed on 5 minute, 4 range and 800 tick charts, the 5 minute chart will display levels from all 3 charts.
April 20, 2026
Your Optimal Strategy Already Exists
April 14, 2026
Top 3 Automated Setup Strategies: Simple and Straightforward
April 7, 2026
Why Order Flow Isn’t Enough
Enter Email for Updates