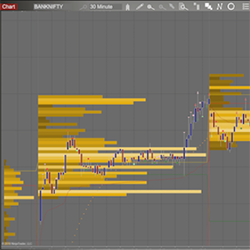
Bell-VSA is designed to consolidate both fundamental and technical analysis into a solitary approach. The Bell-VSA features Volume Spread Analysis Signals, volume profile & customizable colors.
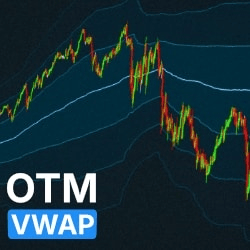
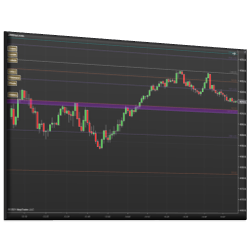
OTM VWAP Free plots the daily VWAP with deviations to reveal equilibrium zones and institutional price levels. With professional design and smooth performance, it provides a clear and reliable price-to-volume reference for dynamic support, resistance and directional bias.
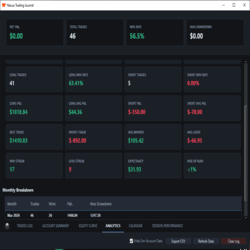
Nexus Trading Journal is an automated journaling tool for NinjaTrader that tracks trades, PnL, commissions, and performance metrics in real time. It helps traders analyze behavior, improve consistency, and make data-driven decisions.
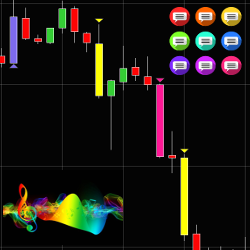
Highly customizable indicator allowing traders to track volatility without spending time staring at a screen. Candlesticks are represented by different custom colors depending on the direction of price movement & its amplitude. Notifications are also sent via email, text or by your favorite sound.
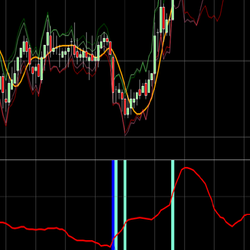
This indicator is extremely versatile and can be used in several time frame charts and even bar charts including range, tick or volume. It works best for instruments like NQ, ES or YM over tick charts. See the real price movement and identify the spikes in the curve plot.
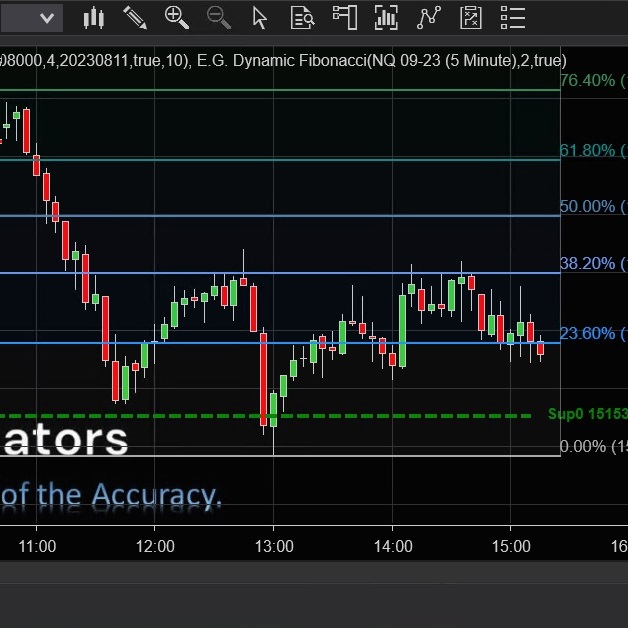
The E.G. Dynamic Fibonacci is an innovation developed by the scientists of E.G. Indicators; dynamically moves to indicate profit targets and another confirmation for the E.G. Trigger Point.
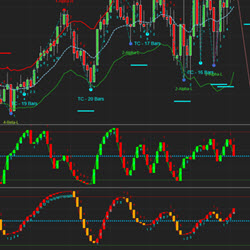
Automatic Cycle Bands, GANN Fan and Fibonacci plotting. Improved double smooth Stochastics, double smooth averages indicators – trend analysis / reversals, 3 volume delta indicators. True average price.
The Key Levels Confluence Indicator calculates various daily levels and combines them into powerful zones where price action is likely to respond in the future. Daily levels include the Open, High, Low and Close (OHLC) of past days, Fibonacci Levels, Whole Numbers, Current Day Levels and Pivots.
TWM builds technology that lets people follow, manage, and control professional traders and trading bots in real time. Our mission is simple: transparency, smart risk tools, and full client control.
VWAP Bands is a FREE indicator developed by NeoTraderBot that plots the session's VWAP along with customizable bands based on multiples of its standard deviation.
April 20, 2026
Your Optimal Strategy Already Exists
April 14, 2026
Top 3 Automated Setup Strategies: Simple and Straightforward
April 7, 2026
Why Order Flow Isn’t Enough
Enter Email for Updates