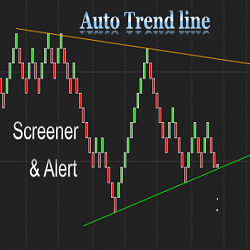
The Auto Trend Line Alert indicator will automatically plot the upper and lower trend lines based on the most recent swing points. It works on all timeframes. The NinjaTrader Market Analyzer makes it possible to track price action related to trend lines in any timeframe.
TurtleMetrics is the only trading journal built exclusively for NinjaTrader futures day traders. Automatically sync your trades via our native AddOn, analyze performance with futures-specific metrics, and improve your edge with one-click setup tagging.
Stop downloading Market Replay data one day at a time. AT Market Replay Data Pro lets NinjaTrader users automatically download replay data for multiple markets and date ranges, streamlining preparation for testing, review, and strategy development.
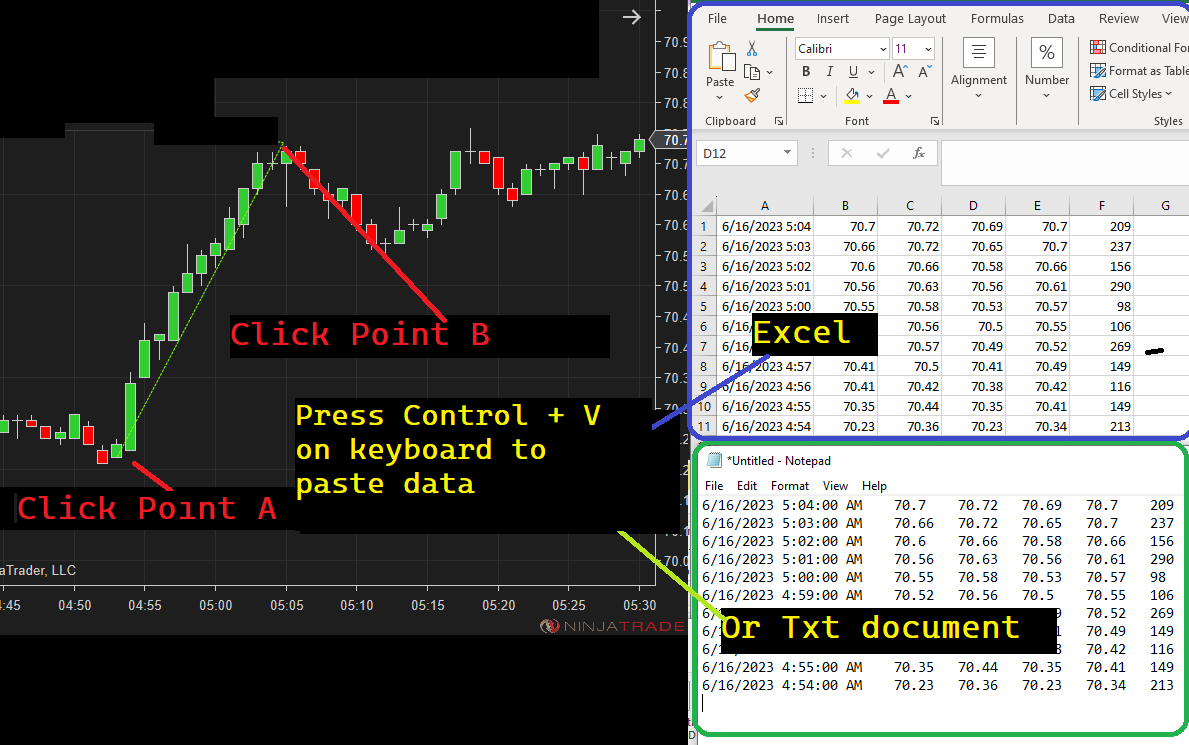
This innovative tool allows you to select any two points on your chart – effortlessly copying the corresponding bar values – and paste them directly into Excel or a text document using the familiar Ctrl+V shortcut.
DiNapoli Levels are a combination of leading and lagging indicators providing predefined entry levels, reasonably tight stops, and precalculated profit targets. This package includes the Auto Fibonacci Retracement tool, proprietary Oscillator Predictor and all new MACD Predictor with video demos.
At ProlongWealth Trading, they offer a gateway to the Futures Prop Firm industry through tailored recommendations, exclusive discounts, and comprehensive YouTube education.
This intelligent indicator uses three different metrics to confirm trend strength so that you can plan your trades with greater confidence. It pinpoints precise moments to enter trades. 1-2-3 Strike! has innovative features like smart signals, performance statistics and attractive visuals.
Streamline your trading with 1P Algorithms' automated solutions. Gain access to three strategies, 1P Academy courses, and daily market analysis. Perfect for beginners and busy professionals. No manual trading required. Empower your trading journey today!
By automatically drawing significant price levels, such as ADR (Average Daily Range) min and max values, yesterday’s OHLC, pivot points (S1, S2, S3 and R1, R2, R3), and weekly OHLC levels, this indicator offers valuable insights to help you make more informed trading decisions.
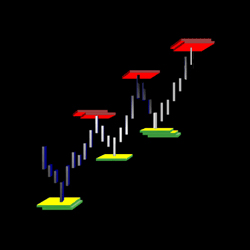
Q-GZone provides visual gap zones between the bars. Gaps occur when a significant imbalance exists between buy and sell orders. It can lead to a gap in the price as the market seeks to match these orders. The market tends to return to and fill in these gaps.
April 20, 2026
Your Optimal Strategy Already Exists
April 14, 2026
Top 3 Automated Setup Strategies: Simple and Straightforward
April 7, 2026
Why Order Flow Isn’t Enough
Enter Email for Updates