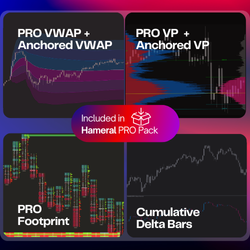
Get 7 powerful Order Flow indicators for the price of one. Automatically detect Footprint Imbalance Zones, Absorption Zones, and Volume Profile Key Areas, use Multi-Timeframe VWAP, and uncover buyer vs. seller pressure in real time. ✅ Lifetime license – no subscription 🎁 Extra bonuses included
Getting out of trades early? HGA Dashboard features a unique profit trailing system that traps price action for larger winning trades, as the trade continues to move in your direction. Moves the Take Profit and Slop Loss in tandem. Fully customizable for any instrument.
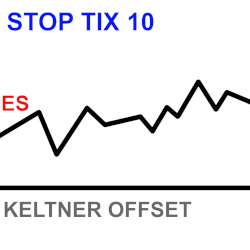
Stop Keltner uses Keltner Band distance to help give an estimated stop-loss in ticks, which is displayed in an easy-to-read text box on the chart. It’s also an excellent backtesting tool for getting estimated stops when identifying past trade entries on historical bars. Built for ES momentum traders
Trade Journaling, Trade Copying between multiple accounts and multiple firms with NinjaTrader and Tradovate.
Automation engine for NinjaTrader; combines indicators and custom conditions; filter entries by delta, volume, time or VPOC; manage trade size, stops and daily limits; tick‑accurate backtesting; design complex strategies without coding using a central panel.
Its only job is to show you the exact price level where the trade stops making sense - based on recent volatility. A premium, minimalist stop reference for NinjaTrader.
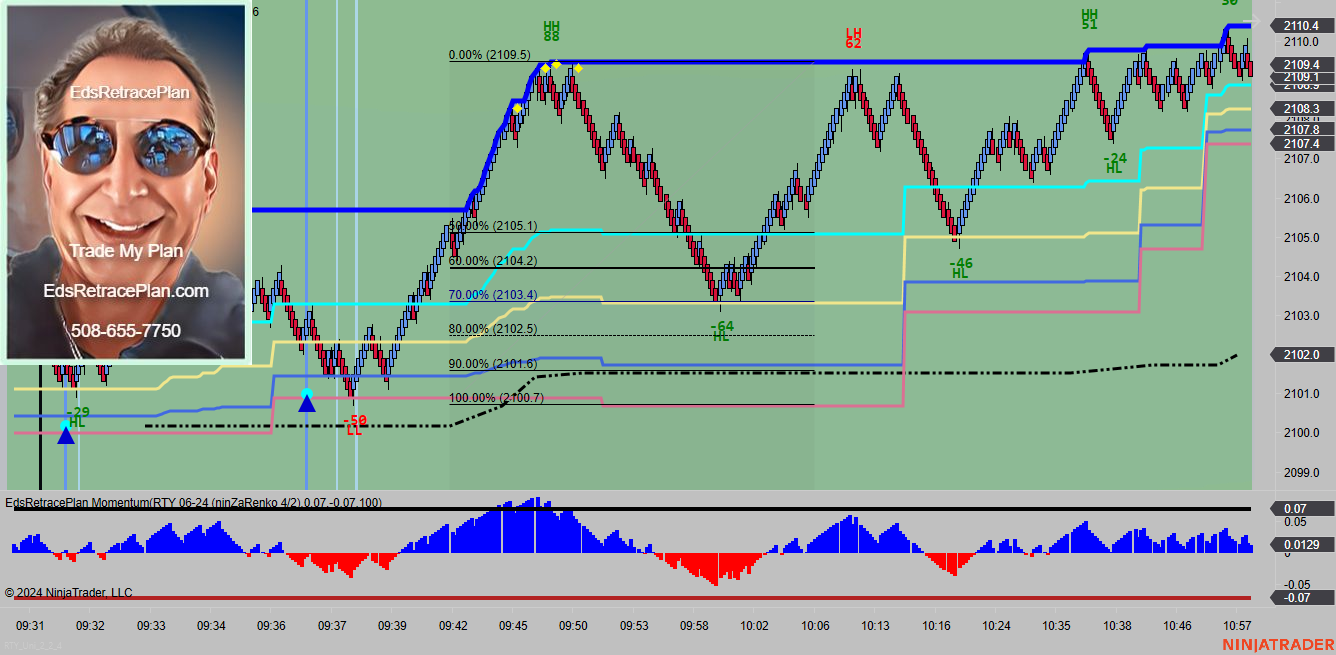
EdsRetracePlan, the innovative system that provides specific day trading signals for ES, YM, RTY, NQ, CL and GC, is now broadcasting live charts to the EdsRetracePlan YouTube channel, daily from 9:00AM to 11:00 EST. For the YouTube URL to this daily show please send an email to [email protected].
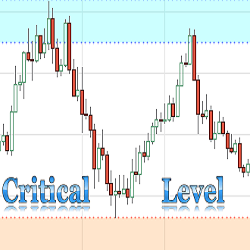
The purpose of this indicator is to automatically plot critical support and resistance levels on a chart. The Critical Support & Resistance Level Indicator comes with customizable alerts and can be added as a Market Analyzer column.
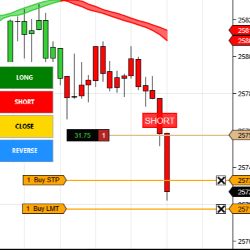
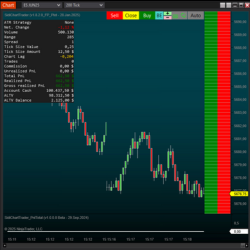
Chart‑trading interface with price ladder, floating buy/sell/close buttons and hotkeys; supports break‑even, daily profit/loss and trade limits; integrates Footprint signals for auto‑entries; real‑time colour and layout customization via RTS; optional auto‑breakeven.
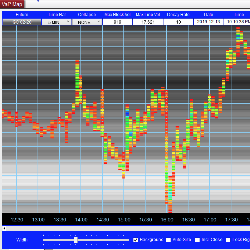
Visualize the market like never before. The VAPMap (Volume At Price Map) displays the total volume traded at each price and time, using a color spectrum from red (lowest) to blue (highest). The background lines show the total historical traded volume for every price level. Click for a free trial.
March 31, 2026
Candlestick Patterns in Adaptive Markets
March 25, 2026
Day Trading With The iNewton Automated Trading System 2026
March 13, 2026
Bridging the Gap
Enter Email for Updates