The SuperDOM Average Price Column shows a position average price accumulated since the first order execution. All opened and closed executions from the beginning of the position are used for the calculation. Save time by knowing your current position's average price for all of your past entries!
MBoxWave Algorithmic Buy / Sell Signals use Wyckoff concepts in analyzing waves, volume, delta volume, effort / result, etc... It allows you to easily scan charts for certain conditions to meet a criteria and then showing a signal that a potential trade setup has occurred.
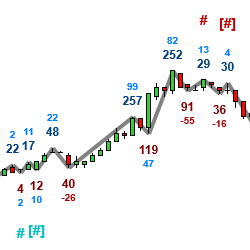
Samri Math Price-in-Time is a comprehensive tool for traders using Murrey Math methodology. This indicator calculates not just PRICE levels, but also sets the price in TIME. Easily switch between time frames (day or minute only) with the user-friendly interface.
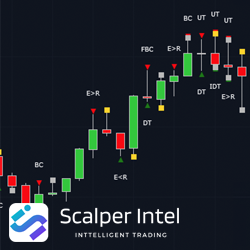
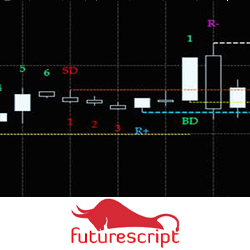
This indicator focuses on identifying the Sign of Strength (SOS) and the Sign of Weakness (SOW) for you and plots them on the Chart. This indicator also studies "The Next Bar" to confirm/refute SOS/SOW.
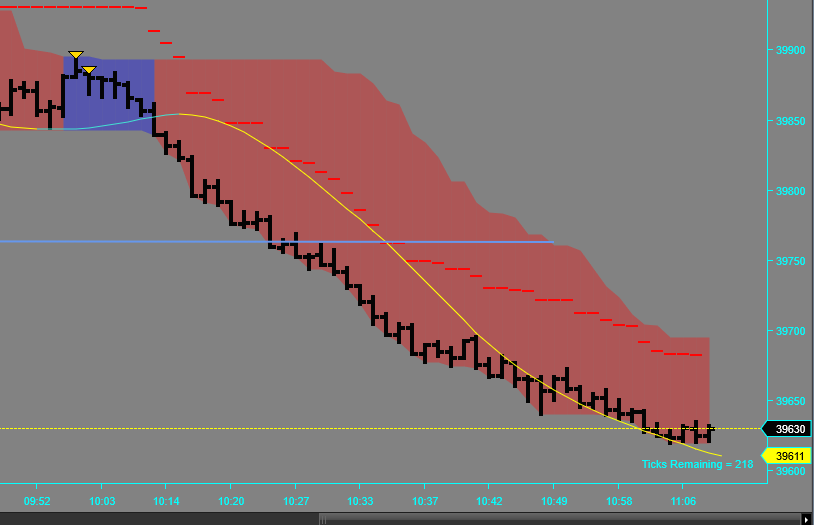
Shot Caller is a time- and volume-driven indicator, utilizing eight different data points to help identify potential short term trends in the market. Once engaged, the channel will be highlighted BLUE or RED and provide signal triangles to aid in the decision making process.
Toni Hansen’s most popular online trading course is now available as a boot camp! Originally developed by Toni in the late 90s, her straightforward trading methodology has withstood the test of time.
Simplify trading screens, and be the first to spot the trend. HeatMap is a tool that informs you when futures, forex or equities markets are all correlated in the same direction, or mixed. Know at a glance when follow through is high, or when the markets are sideways. Get the HeatMap now!
The Cycle Trend was developed as a way to evaluate trends with as little lag as possible compared to more conventional indicators such as the ADX or MACD. The idea behind this is that the price action and the shapes of the bars relative to each other is more accurate at defining the mood.
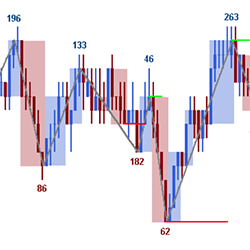
The MAutoFloorCeiling indicator is the culmination of over 2 years of research to determine support / resistance levels automatically. The heart of it utilizes a powerful algorithm based on Wyckoffian concepts of waves, volume, and price levels to gain insight on potential entry points.
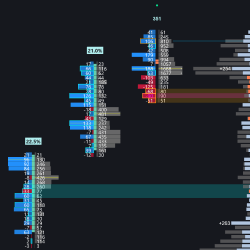
Upgrade tick-level data into clear footprint bars to spot A+ setups. Reveals real-time institutional order flow, including bid/ask/delta/total volume, delta imbalances, POC/bar value area, divergence/absorption, stacked imbalance zones, zero-print zones, and a volume profile with filtered delta.
March 31, 2026
Candlestick Patterns in Adaptive Markets
March 25, 2026
Day Trading With The iNewton Automated Trading System 2026
March 13, 2026
Bridging the Gap
Enter Email for Updates