QuantCycles harnesses artificial intelligence (AI) and machine learning (ML) for superior predictability, stability and chart analysis. With refined algorithms using advanced Fourier cycle analysis, Hurst cycles and W.D. Gann theories, this latest version delivers exceptionally accurate forecasting.
TTT Range Indicator plots the data from the TTT E-book directly on NinjaTrader Charts. Determine the range of an instrument prior to potential reversals, and the average once the high and low for the day is recorded. Learn more!
This ultimate package provides high-quality, reliable signals with quick, easy, and precise order entry. Agile Piranha Scalping generates rapid, high-frequency signals, swiftly executed within a small market range. It elevate your scalping with efficiency and reliability.
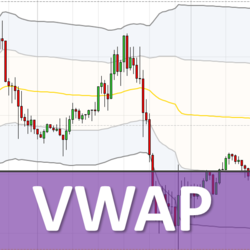
VWAP shows S/R levels, which the majority of institutional algorithms use. It works with all trading instruments (Forex, Futures, Indexes, Commodities, Stocks) and time frames (day trading, swing trading, position trading). It includes VWAP Training Video Course and VWAP trading setups.
This is a UNIVERSAL solution to regular divergence trading. Divergences can be identified by comparing price action and an oscillator of your choice. Yes, you can freely use this NinjaTrader divergence indicator with RSI or MACD, stochastic, CCI, and other indicators, from any vendors!
The system looks for the highest high and lowest low over past bars, then the system tags the entry with a line that is proportional to your entry settings. Then the strategy calculates: Imbalance, velocity, momentum and probability.
The Block Trades Indicator for NinjaTrader displays large volume block and cluster trades as colored bubbles directly on your chart at the price where the block appeared. Green highlights strong buying, red highlights heavy selling. Bubble size scales with the size of the block trade so you instantl
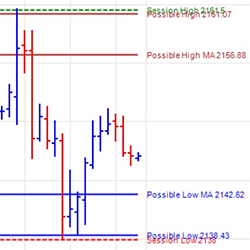
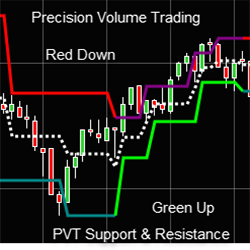
Precision Volume Trading Support & Resistance measures each swing point for traders to know where buyers and sellers are.
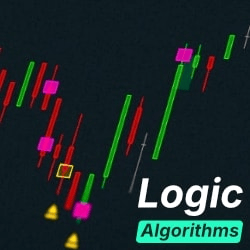
Logic Algorithms combines three order-flow engines—Imbalance Zones, Absorption Finder and Cluster Analysis—to reveal critical market levels, liquidity traps and high-probability movement zones. A consolidated view of institutional behavior for precise real-time decision making.
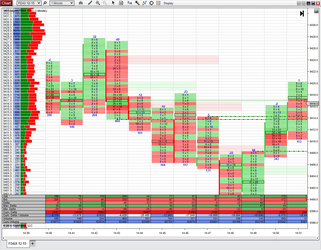
Pure and simple footprint (aka market profile or order flow chart) and volume profile chart add-on for NinjaTrader. Displays bid and ask volume traded at each price at each bar. Alternative charts – range, volume and tick charts - are also fully supported.
March 31, 2026
Candlestick Patterns in Adaptive Markets
March 25, 2026
Day Trading With The iNewton Automated Trading System 2026
March 13, 2026
Bridging the Gap
Enter Email for Updates