LizardIndicators offers custom NinjaScript programming for indicators, strategies and a wide range of trading tools. The custom programing service also includes the modification of existing scripts. Contact LizardTrader today for a quote or consulting session today!
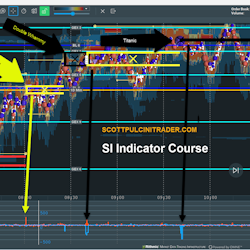
Scott's updated SI Indicator course for 2023-2024 features over 4 1/2 hours of content spanning six parts and 27 different educational videos.
Account Guard is your risk-management copilot that keeps you trading in a structured, controlled way. It protects your accounts from oversized losses or blow-ups and lets you define max risk clearly so you never spend days trying to win back a single session.
The Candlestick Express Class is the simple way to learn candlestick patterns and strategies. Traders quickly learn to combine candlesticks, Western technical signals, and trade management strategies. These techniques are useful in Forex or any other market. Get instant access when you register!
FXAN delivers a full approach that combines institutional tools, education, and professional support to help you trade with confidence. Their algorithms and training program have been developed by trading experts who’ve dominated markets for years.
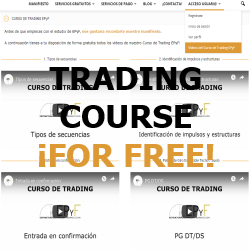
Do you want to know the trading setups we use? Create your own profile FREE on our website and you’ll have access to our course videos where we explain each of our patterns. Gain the knowledge to access our EPyF Trading Room and learn our way of understanding the market.
NinjaTrader 8 strategy unmanaged mode trade engine base foundation for futures, comprising of 4 bracket capacity, all in scale out - single entry position - multiple exits per trade operation, hybrid UI controls to allow semi/auto modes in trading the best of both worlds, open source with samples.
Automatically snap trade execution screenshots or take a snap at a set bar interval. SnapMyTrade assists traders with journaling and post trade analysis.
QuantCycles harnesses artificial intelligence (AI) and machine learning (ML) for superior predictability, stability and chart analysis. With refined algorithms using advanced Fourier cycle analysis, Hurst cycles and W.D. Gann theories, this latest version delivers exceptionally accurate forecasting.
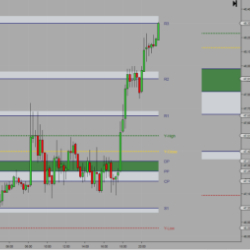
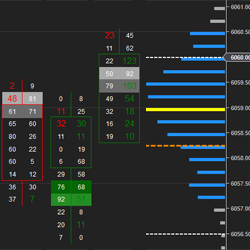
Order Flow is the study of tick-by-tick volume for trading Futures, Forex and Equities. The OFA toolset provides custom charts and advanced drag-and-drop profiling features designed to easily identify precision entries and targets. Get started with a free order flow training class today!
May 31, 2026
Order Flow Trading Explained: Order Types, Absorption, and Taking Emotion Out of Execution
May 14, 2026
Order Flow Analysis with AI Integration: A Practical Guide for Traders
April 20, 2026
Your Optimal Strategy Already Exists
Enter Email for Updates