The Buy/Sell Zones are an adaptive approach to expansion and contraction within market rotations. Each rotation provides an area of interest for either the bid or offer, where they need to engage in order to protect the possibility of further extension. This approach allows you to trade with trend.
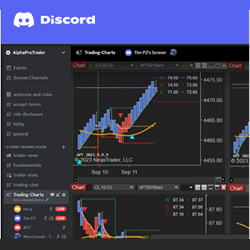
Trading group support and education, live market trading and NinjaTrader 8 add-in for E-mini trading turnkey system: ES, NQ, YM, RTY, CL, GC. Discord trading group for futures NYSE hours. E-mini futures trading, live market trading commentary, charts, mentoring and more.
A robust tool specifically designed for strategy development. Leveraging trend, momentum, volume, and volume delta, it helps traders create and refine a variety of trading strategies.
This indicator for NinjaTrader 8 draws automated lines based on support and resistance levels. Over time, they at Live Scalp Review had noticed support and resistance interactions and patterns - which led to the development of this indicator.
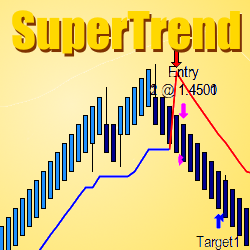
The TIS_Supertrend Indicator is a tool designed to trade volatile markets. The indicator produces 2 types of signals, a trend change arrow each time a trend line is broken and a pullback entry subsequent to the trend change. Download the TIS_SuperTrend today!
With decades of experience, EMS specializes in the creation of custom software for clients worldwide. For over twenty-five years, EMS has been helping our clients reach their goals with honesty, integrity and fairness. Contact us for a complementary consultation.
David Misselhorn is a software developer with over 30 years of development experience in trading clients, market data and order-execution software. He writes indicators and strategies for individuals wishing to automate their trading and analysis activities.
NinjaTrader offers NinjaScript (C#) for creating advanced strategies, a no-code Strategy Builder for automation, and a highly consistent backtesting engine that handles slippage, executions, fill types, and tick replay to deliver favorable results.
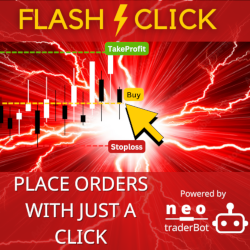
With FlashClick, you can place orders instantly with just a click on the chart, ensuring you're always ready to act quickly. The tool integrates seamlessly with ChartTrader, allowing you to preview ATM orders before executing your trade, giving you more control and confidence in every decision.
Volatility Quality Indicator (VQI) is a technical indicator that was developed to identify quality stocks with low volatility. The indicator is based on the assumption that assets with low volatility are less risky & more stable. The original concept by Thomas Stridsman was first published in 2002.
March 31, 2026
Candlestick Patterns in Adaptive Markets
March 25, 2026
Day Trading With The iNewton Automated Trading System 2026
March 13, 2026
Bridging the Gap
Enter Email for Updates