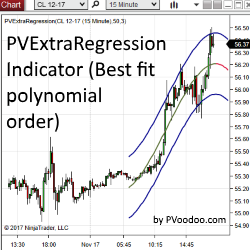
PVExtraRegression Indicator & Strategy is a regression channel taken to the next level, calculated using higher order polynomials. Use PVExtraRegression as a discretionary indicator or automated strategy!
See where real volume is concentrated. The Enhanced Volume Profile exposes institutional interest, high-volume nodes, value zones, and breakout areas so you can trade where big money is positioned - not where retail guesses.
Frustrated by one-model courses? TradeX's PHD-level Turtle Soup course delivers 8 models, 500+ slides, live trades, Q&As breaking down everything from context, market profiles, market structure and Entry Techniques. Join hundreds of funded traders using proven ICT strategies and turning full-time!
The ultra-premium bar counting solution for NinjaTrader. BarCount Ultimate™ gives traders perfect bar indexing, clear session levels, and powerful chart visuals. Built for professionals. Start using the world’s most advanced bar counter today.
Analyze trade setups with the RiskReward Indicator. This free tool simplifies risk assessment, enabling precise calculation of potential gains versus losses, helping traders plan their strategies confidently. Draw the Risk/Reward ratio tool anywhere on the chart just by clicking on the mouse wheel.
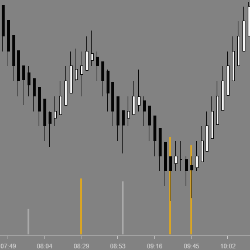
EPyFMomentumCandles is an indicator which helps to detect momentum. When a setup is confirmed by a momentum candle, we pay special attention as this is an important factor in our analysis. This indicator is also used to identify relevant areas during each session.
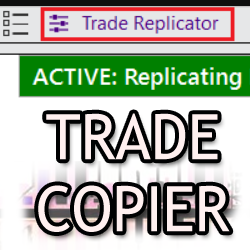
A high-reliability Trade Copier / Trade Replicator for your prop firm accounts. - Detects and handles Trades executed inside and outside NinjaTrader. - Seamlessly clones all executed trades to your list of follower accounts. - Works with multiple account types. - One time fee. Lifetime updates.
We provide traders with an opportunity to earn live funding based on their trading performance in simulated accounts.
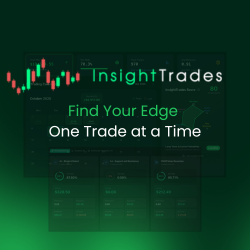
InsightTrades empowers NinjaTrader users with AI-powered performance analytics, automated trade journaling, pattern detection, and personalized coaching. Track your edge, eliminate costly mistakes, and accelerate improvement with deep insights from our platfrom
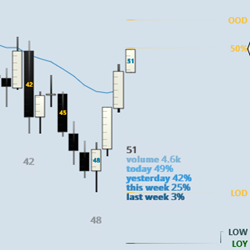
Volume odometer on your chart. Identify a sliver of volume from your preferred volume source directly on your chart.
March 31, 2026
Candlestick Patterns in Adaptive Markets
March 25, 2026
Day Trading With The iNewton Automated Trading System 2026
March 13, 2026
Bridging the Gap
Enter Email for Updates