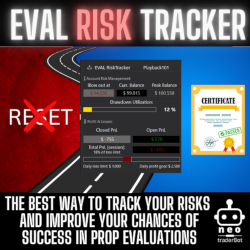
Eval Risk Tracker is an essential tool for traders looking to get funded by prop firms. Designed to provide detailed insights into your risk exposure, it features an integrated dashboard with NT charts, enabling you to manage your evals effectively and significantly increase your chances of success.
Traderistic helps to get rid of fear in trading by looking for signs of fear that can impact a trader’s performance. This tool live-monitors the biggest muscle in the body, the heart. Traders can develop a new level of awareness to increase control and serenity, making trading an enjoyable exercise.
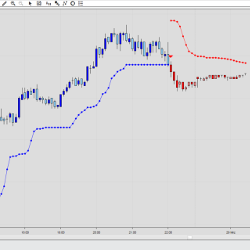
The SuperTrend U11 is a stop and reverse (SAR) indicator that trails price action. The trailing stop adjusts to both trading prices and volatility. When volatility is high, the trailing stop is further away from prices. When volatility is low, the trailing stop moves closer to prices.
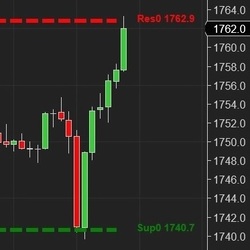
Based on an Artificial Intelligence (AI) engine, the E.G. Trigger Point calculates support and resistance (S&R) lines. The S&R are specific price points on a chart expected to attract the maximum amount of either buying or selling.
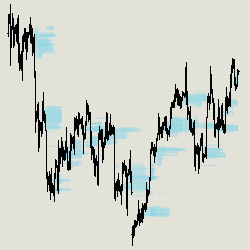
Dynamic Volume Profile is an optimized indicator which represents market profile with live and historical volume data. This strategy and backtest friendly indicator enables users to easily analyze years of historical data and adjust parameters dynamically from both the menu and chart.
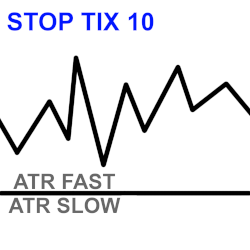
This indicator uses ATR calculations to help give an estimated stop-loss in ticks, which is displayed in an easy-to-read text box on the chart. It is also an excellent backtesting tool for quickly getting estimated stops when identifying past trade entries on historical bars.
NinjaProgramminSchool has been assisting traders for over 5 years in the creation of custom indicators and automated strategies at a reasonable cost. Do you have an idea you want coded or automated? Let us walk you through the process.
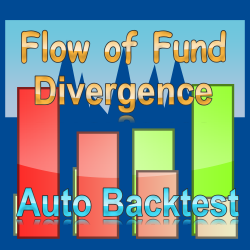
The Flow of fund(FOF) divergence signal indicator consists of the following parts: The Flow of fund histogram, FOF trend line, back test result in sub chart and divergence signal in main chart. The signal is instantly drawn on current bar and will not repaint.
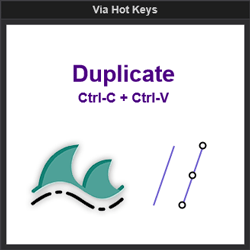
This indicator allows the user to copy-paste in one button, increasing application functionality and user charting efficiency.
CB ZoneChart V5.0 update was just released. It now comes with turning bars included to help gage the tops and bottoms or turns in the market. Also includes the opening ranges, zigzag support and resistance, golden zone Fibs, and the most requested blue dotted lines support and resistance.
May 14, 2026
Order Flow Analysis with AI Integration: A Practical Guide for Traders
April 20, 2026
Your Optimal Strategy Already Exists
April 14, 2026
Top 3 Automated Setup Strategies: Simple and Straightforward
Enter Email for Updates