Never Miss a Trade. The only live trading room that runs by very sophisticated bots. Join the rom and copy the bots trades 24/7.
Trade smarter with multiple candlestick patterns. This indicator uses pattern recognition to scan for 16 different candlestick patterns. It detects bullish, bearish and gap patterns. It can be used with Bloodhound and NinjaTrader's Market Analyzer.
Stocks, futures and forex trading analysis education via daily coaching and education using an institutional order flow methodology. Unlimited mentorship, an advanced curriculum course, trading software, forum and class recordings are all included! Learn More!
The xBrat Slingshot Automated Strategy Builder (ASB) is designed to capitalize on precise pullback zones, it provides comprehensive trade management. Fully automated, this ASB executes trades for you, ensuring optimal entries and exits. Trade with confidence and control with the Slingshot ASB!
Swing VWAP automatically plots Anchored VWAPs from recent swing highs and lows, taking much of the work out of placing and maintaining anchored VWAPs on your charts.
This groundbreaking tool harnesses the rhythm of market momentum and the precision of VWAP analysis to identify exceptional trading opportunities. Perfect for scalping and day trading, it automates every step of the process, ensuring flawless execution and efficient trade management.
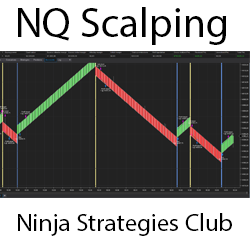
Open-source code can be developed. If you want, you can add different strategies on it. Lifetime free updates. Take-profit at three, five or seven ticks, stop-loss at 13 ticks. Change the take-profit and stop-loss settings.
Predict the ultimate stop level using the sophisticated NSR Triple STX, which performs over a million calculations per bar. Measure the trend strength using the non-arbitrary Ocean math with the BTX indicators. Includes Ocean Classic. Sign up for a 30 day free trial!
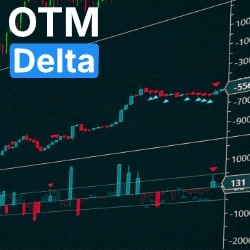
OTM DeltaBar Free displays cumulative session delta and per-bar delta direction with professional accuracy and performance. A clear view of buying and selling pressure on every candle, ideal for traders exploring order-flow analysis without technical limitations.
HelloWin Backtest is a revolutionary trading analysis tool offering an intuitive PnL graph for real-time system evaluation. Supporting various bar types, slippage adjustments, and a unique two-round logic for defining entries, it mirrors the strategic approach of professional traders.
December 22, 2025
The Hidden Landmarks of Price Action: Trading With Liquidity Zones
December 2, 2025
Footprint Made Clear: Structure, Volume, and Order Flow Insights
November 25, 2025
Advanced Trading Psychology: Go From Average to Elite
Enter Email for Updates