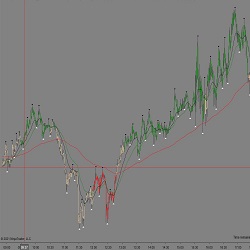
Trend Friend is a simple indicator designed to identify when the price in different time periods is aligned with select moving averages. It is not a closed methodology to operate but you can establish two systems to use this indicator: aggressive operation to paint signals or wait for a retracement.
Enhance your trading with Trade With The Bull Software. Optimize your strategy using advanced algorithms and robust indicators for precise entry and exit signals. Key features include advanced technical indicators, customizable parameters, real-time market data integration, and more.
Quickly save and load sets of parameters in NinjaTrader. If you are tired of changing indicator and strategy parameters multiple times, SaveAndLoad adds a new system-wide feature for saving and loading any number of parameter sets, for indicators, for strategies, and for the Strategy Analyzer!
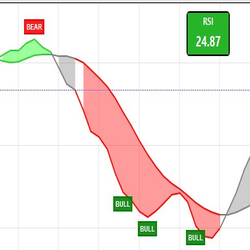
This has a colorful band that has different width that shows market Strength. It prints Bull - Bears - Pivot signals, that allow traders to catch reversal very early. It also has an RSI window that changes colors, runs on each tick, and is moveable in the chart.
This market-leading Renko book by algorithmic trading expert Stephen Hoad reveals unique, precision-driven strategies for futures traders. Packed with advanced technical analysis, edge-building tools, and proven setups. Get it now at TheStopHunter.co.uk/bookstore.
Traderistic helps to get rid of fear in trading by looking for signs of fear that can impact a trader’s performance. This tool live-monitors the biggest muscle in the body, the heart. Traders can develop a new level of awareness to increase control and serenity, making trading an enjoyable exercise.
Put today’s high and medium economic events right on your chart. News Markers Lite reads a lightweight calendar file and plots each event at the exact minute it occurs on your intraday chart. Country flag at the event time and a vertical line to line up price with the headline.
TWM builds technology that lets people follow, manage, and control professional traders and trading bots in real time. Our mission is simple: transparency, smart risk tools, and full client control.
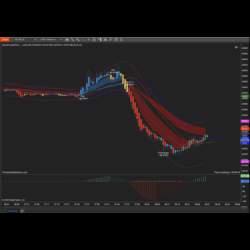
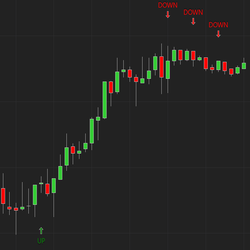
A machine learning indicator that forecasts short-term UP or DOWN moves with high-confidence signals. It retrains on live data, blends multiple timeframes, and supports filters like EMA slope, ATR regime, or TheStrat patterns. Visual labels and alerts make tracking trades simple.
FXAN delivers a full approach that combines institutional tools, education, and professional support to help you trade with confidence. Their algorithms and training program have been developed by trading experts who’ve dominated markets for years.
March 31, 2026
Candlestick Patterns in Adaptive Markets
March 25, 2026
Day Trading With The iNewton Automated Trading System 2026
March 13, 2026
Bridging the Gap
Enter Email for Updates