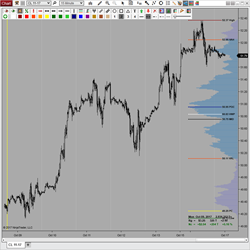
Volume Profile Composite features 7 configurable Profile Durations (including Daily, Weekly, Monthly, Contract, User Defined), 8 Levels of Significance (VPOC, VA’s, VWAP, High/Low/Mid, PClose), 3 Modes of Calculation (bar/min/tick), a profile summary, and simple configuration thru the toolbar icon!
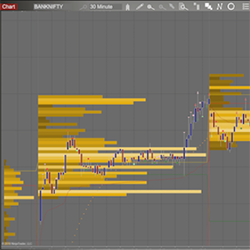
Bell-VSA is designed to consolidate both fundamental and technical analysis into a solitary approach. The Bell-VSA features Volume Spread Analysis Signals, volume profile & customizable colors.
The Candlestick Express Class is the simple way to learn candlestick patterns and strategies. Traders quickly learn to combine candlesticks, Western technical signals, and trade management strategies. These techniques are useful in Forex or any other market. Get instant access when you register!
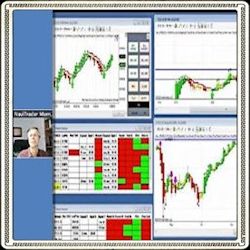
Would you like to improve your trading? Learn how to analyze the live market & the key factors that are critical for success! Open M-F, 9 – 11 AM ET, the Member Room provides the knowledge & demonstrates the tools needed to trade the ES, NQ, CL & more. Get started NOW with FREE live market training!
Spot real participation instantly. QaSH RVOL (Relative Volume) compares current volume to its historical norm at the same time of day, giving you an instant read on whether activity is elevated, average, or weak. With rollover-aware futures calculations, you can quickly judge if a move has convictio
We are professional NinjaScript developers with more than 20 years of experience. We develop custom-made indicators, addons, drawing tools, market analyzer columns, automated strategies and much more. Contact us now and receive a free quote!
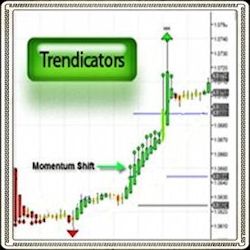
The Trendcators Indicator suite is designed to unclutter the market via built in analysis tools to pinpoint entry/exit signals with ease. It’s fully customizable providing you with the flexibility to determine which aspects of technical analysis are important for your trading! Get Started Now!
You can now calculate your recommended trade position size for stocks based on the current market volatility and your risk appetite, in real time. Once you input the “RiskPerTrade” amount, It displays the number of shares in your market analyzer column. Get this powerful risk management tool!
Our Stock Trading Package includes pre-built workspaces, chart templates and Market Analyzers with scanners and alerts. Use ATS Chart Trader for trade management, ATS Inflection Point indicator for daily inflection points and use DTS Ichimoku Cloud Pattern for trade setups. Education is included!
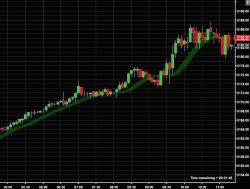
Is it a trend or a movement? Trend Ribbon uses one color to indicate an uptrend and another to indicate a downtrend. The ribbon shows trend strength and the transition of direction when the ribbon narrows and “flips.” Fully adjustable to your style and timeframe: day, swing or longer trading.
March 31, 2026
Candlestick Patterns in Adaptive Markets
March 25, 2026
Day Trading With The iNewton Automated Trading System 2026
March 13, 2026
Bridging the Gap
Enter Email for Updates