The R-Bot / Reversal Strategy is an automated trading strategy for NinjaTrader. It is designed to identify potential market reversal conditions using technical indicators, pattern recognition, and configurable trade management settings across multiple markets and timeframes.
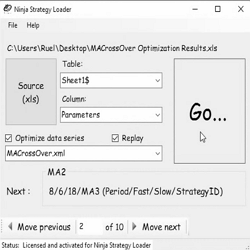
The Ninja Strategy loader allows traders to quickly and accurately load strategies into the NinjaTrader Strategy Tab or Chart Windows. Learn more!
An extendable rectangle drawing tool built for supply & demand traders. Toggle Supply, Demand, or Default zone types via right-click, extend zones with built-in buttons, and display price labels automatically. Free download at PureFinancialAcademy.com!
Specialist providing custom indicators, automated strategies, and strategy stabilization. Focus on execution behavior, trade and risk management, session control, and production-grade system architecture for live trading environments.
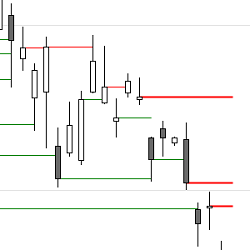
On instruments with regular trading hours you often see gaps on a chart which stay open for more than a day. A couple of times a month these open gaps from prior days also play an obvious role as support or resistance on the intraday chart. These tools are free to download and use!
CB ZoneChart V5.0 update was just released. It now comes with turning bars included to help gage the tops and bottoms or turns in the market. Also includes the opening ranges, zigzag support and resistance, golden zone Fibs, and the most requested blue dotted lines support and resistance.
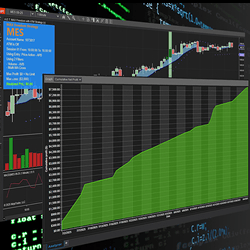
HEXGO FUTURES TRADING BOTS - PREMIUM PLAN - MES, MNQ, MYM, M2K. ENTERPISE PLAN - ES, NQ, YM, RTY.
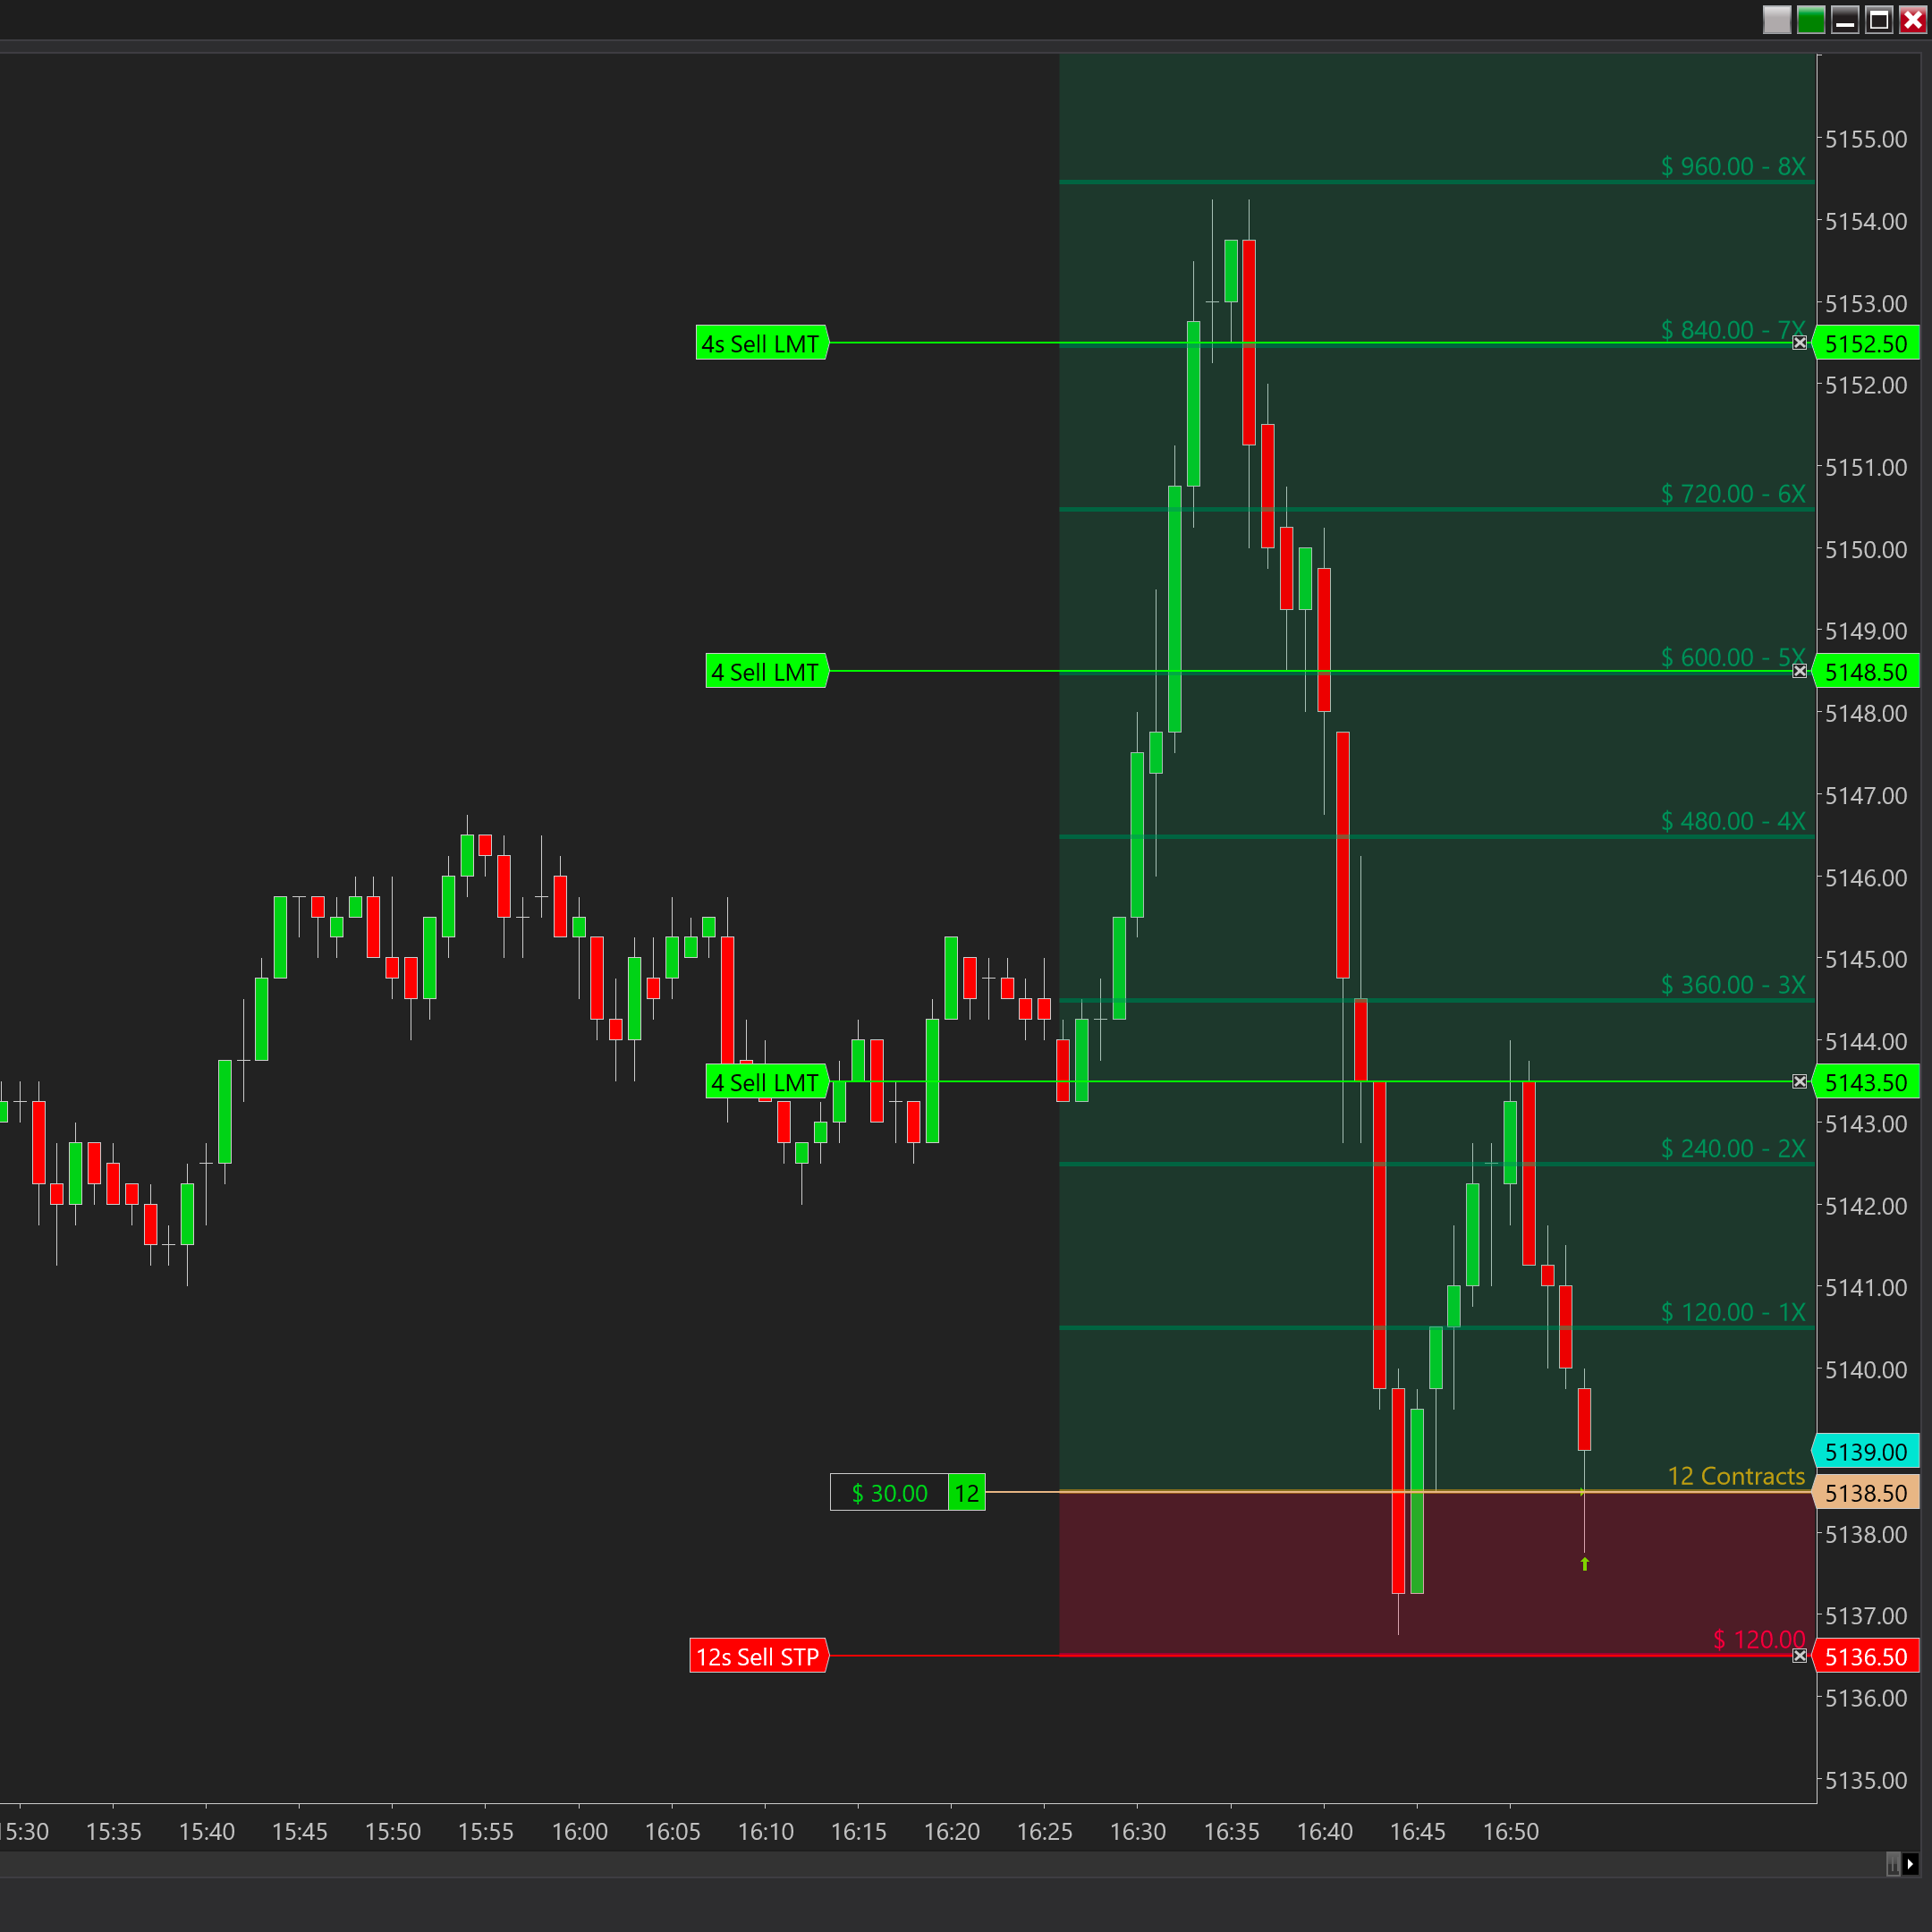
NTRR Risk Reward is a must have add-on that offers full customization, automatically calculates contracts needed based on currency risk amount, auto updates your ChartTrader quantity and your "ATM Strategy" in an instant and allowing you to use one-click entry trading based on the drawn direction.
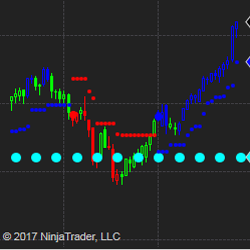
AbleTrend offers a time-tested color-coded trading system featuring dynamic support and resistance indicators that produces buy, sell and exit trade signals. It can be used on any timeframe in the stocks, futures and forex markets. Get started with a 30-day trial for $79 today!
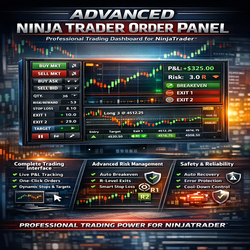
Cot-Trading Order Panel is a professional-grade trading dashboard designed for NinjaTrader, delivering advanced order management, real-time trade monitoring, and sophisticated risk control through a clean and intuitive visual interface.
May 14, 2026
Order Flow Analysis with AI Integration: A Practical Guide for Traders
April 20, 2026
Your Optimal Strategy Already Exists
April 14, 2026
Top 3 Automated Setup Strategies: Simple and Straightforward
Enter Email for Updates