Master the real market mechanics with our Order Flow Training. Learn to read order books, volume profiles, and institutional activity to anticipate moves with precision — designed for traders seeking true professional insight.
The TradingOnes Circle is the community where education, strategy, and investment come together. It is a membership system designed to guide you in understanding structure of the markets through analysis, webinars, and exclusive content based on Christian Ciuffa’s method. Choose your level.
Next-generation support and resistance for active traders. Chartmap™ makes drawing lines on a chart a thing of the past by utilizing an innovative pattern finding algorithm to generate a heat map of powerful support and resistance. Upgrade your charts today with a 7-day free trial.
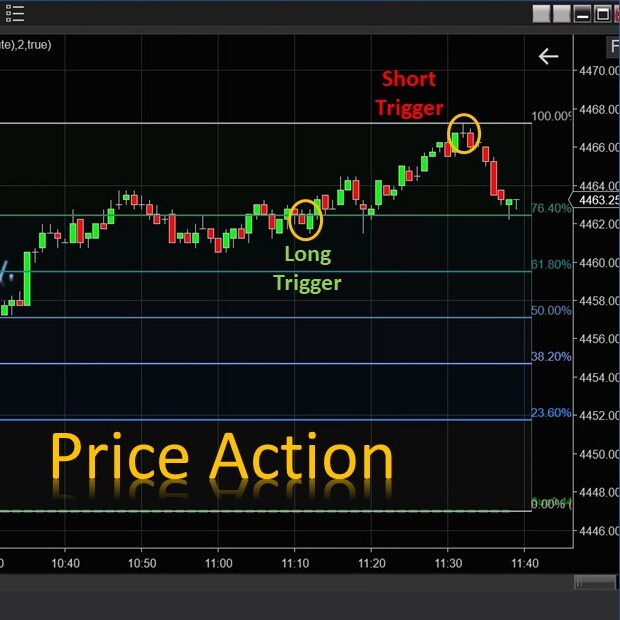
The E.G. Price Action is automatically integrated with the E.G. Trigger Point presented on your chart to generate short and long signals for you. It recognizes Price Action opportunities and generates arrows presented on your chart and sound notifications.
This is the "heads-up display" indicator that has made The Intentional Trader famous since 2009. It will tell you when the “Smart Money” market makers are likely to be manipulating price. If you know that, then you can evaluate what may happen next - a huge edge in day trading!
Stop trading when it matters most. RiskLock locks your NinjaTrader account when daily limits are hit (max trades, profit target, or loss), preventing overtrading and protecting your capital until the next session reset.
The Exhaustion Absorption Detector, which is based on live time and sales data, is designed to display order activity between the bid and offers at market price.
The indicator monitors the accumulation of bar-by-bar volume delta throughout the day. It decides market trends based on the analyses of cumulative delta + moving median of cumulative delta + price action. We can proudly say that this version is a one-of-a-kind delta interpreter.
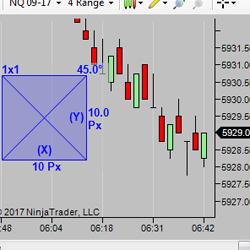
This tool is a valuable visual aid for traders who use Gann, Fibonacci, Point and Figure charts and want to see true angles. Simply load it on the chart and push the toolbar button when you want to use it, then adjust an axis until the chart is square. Using the 'Keep Centered' option will then keep price in the chart area while the chart is squared.
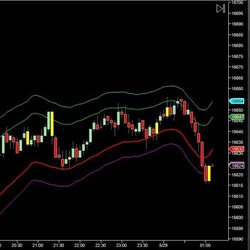
DTB Ultimate Bands is a next-generation of price envelopes that does all the heavy-lifting for traders. Once applied on a price chart, it pinpoints Overbought and Oversold areas with unmatched accuracy. Get a free trial!
May 14, 2026
Order Flow Analysis with AI Integration: A Practical Guide for Traders
April 20, 2026
Your Optimal Strategy Already Exists
April 14, 2026
Top 3 Automated Setup Strategies: Simple and Straightforward
Enter Email for Updates