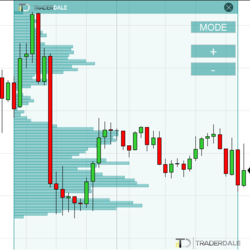
TD’s Flexible Volume Profile helps to reveal institutional trading activity and identifies the strongest support and resistance zones. The use of tick volume data makes it extremely precise, pointing to potential entries. It is easy to learn and simple to use.
The Telegram Price Alert indicator for NinjaTrader 8 is the fastest and most reliable way to stay connected to the markets. Whether you are scalping, day trading, or swing trading, this tool makes sure you never miss a signal.
100% FREE - The TAS Market Map Indicator delivers the most visually appealing customizable market profile tool for traders. Its color-coded sideways histograms clearly reveal volume at price, value areas (red zones), master point of control lines (aqua lines), gaps and congestion.
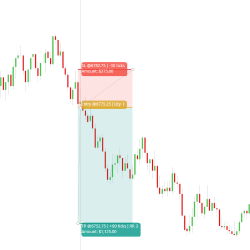
RiskRewardPlus1 is an advanced risk/reward planner for NinjaTrader. It adds hover-only labels, shaded TP/SL zones, smart flip and gap logic, and automatic position sizing by % or currency—giving traders a clean, precise way to plan entries and manage risk visually.
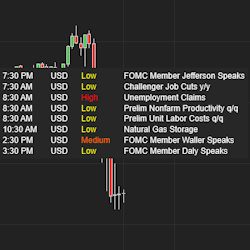
A clean, high-customizable news overlay indicator for NinjaTrader 8. Stay informed about the day's economic events right on your chart.
Catch market imbalances in real time with this algo. TWC Single Print Algo spots single print zones and instantly triggers reversal trades—letting you capitalize on retracements with precision. Semi-automatic, automated, customizable, and built for serious traders who want a reliable algorithm.
DataGrabber™ grabs price and volume data for any futures instrument. It is designed to work with the AI prediction software, AITrendPredictor™. DataGrabber™ data files get fed into AITrendPredictor™ to train the AI model to find patterns on price, volume, day and time to make a price prediction.
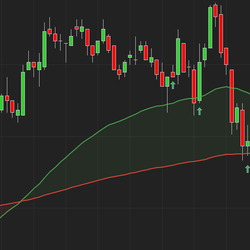
This tool tracks two moving-average retests: price rejecting an EMA from above (bearish) or below (bullish). Choose 2-bar or 3-bar setups, add a volume filter, highlight trend dominance with a glow band, and get fully configurable alerts.
This indicator for NinjaTrader 8 draws automated lines based on support and resistance levels. Over time, they at Live Scalp Review had noticed support and resistance interactions and patterns - which led to the development of this indicator.
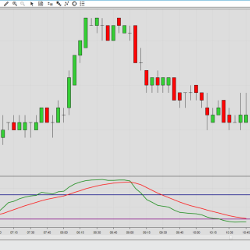
The Slow Relative Strength Index is an adaptation of the classic RSI calculation, customized for use in higher timeframes. The slow RSI calculation compares the close price with an exponential moving average instead of the previous value.
March 31, 2026
Candlestick Patterns in Adaptive Markets
March 25, 2026
Day Trading With The iNewton Automated Trading System 2026
March 13, 2026
Bridging the Gap
Enter Email for Updates