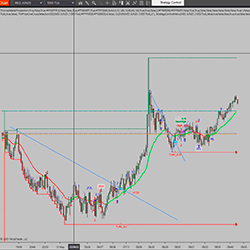
Visual strategy for NinjaTrader 8 based on price action. It highlights 0-1-2 structures, second entries, and failed setups. Helps discretionary scalpers identify key opportunities without executing trades automatically.
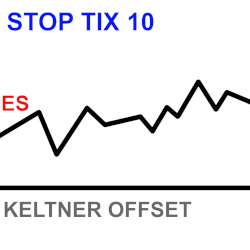
Stop Keltner uses Keltner Band distance to help give an estimated stop-loss in ticks, which is displayed in an easy-to-read text box on the chart. It’s also an excellent backtesting tool for getting estimated stops when identifying past trade entries on historical bars. Built for ES momentum traders
Bold Bot is a strategy for NQ which will analyze the product for long trades.
2 Cores (Intel Xeon E-3.70GHz), 4GB DDR4 RAM, 40GB NVMe SSD, 1x Dedicated IP address, Windows 2019, Free Installation, Unlimited Traffic, RDP/iOS/Android/Mac/Parallel access, Supports All FUTURES Platforms, CLOUD Anti-Virus & Malware Protection, Immediate Activation
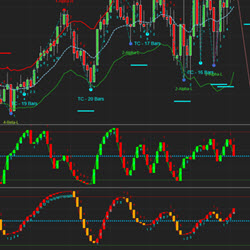
Automatic Cycle Bands, GANN Fan and Fibonacci plotting. Improved double smooth Stochastics, double smooth averages indicators – trend analysis / reversals, 3 volume delta indicators. True average price.
The indicator is compatible with any oscillator, utilizing NinjaScript signals for Market Analyzer, facilitating efficient scanning of numerous instruments simultaneously. The advanced "Lookback" feature enhances precision by allowing customization for swing points and divergence patterns.
BookMap helps traders detect better support and resistance levels by plotting order book data directly on the chart. Through market depth behind price bars, order flow traders can watch the limit order book unfold in real time, highlighting significant price levels such as support and resistance.
Automated Trading Strategy for the MNQ based on user inputted times.
High rated Quant Developer/Trader specializing in NinjaTrader. They have worked with high profile clients/organizations and have professional experience working at an Algo trading desk. They focus on providing value to all their clients and earning their trust.
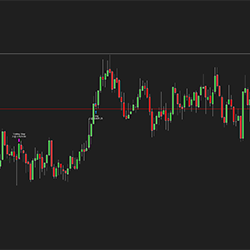
The Steady Turtle Initial Balance Indicator for NinjaTrader 8 plots the IB with key extensions and the midpoint. Ideal for day traders, it highlights breakout levels and support/resistance, offering precise entry/exit zones for opening range and price action strategies.
July 29, 2025
The Patent-Pending Breakthrough Method for Traders Who Struggle With Consistency
July 22, 2025
Top 5 Secrets to Transform Your Trading
July 8, 2025
New Easy Continuator Signal: Pullback Entry With Trend
Enter Email for Updates