Basics of Fibonacci for Futures Trading
February 16th, 2022
The Fibonacci sequence is a series of numbers developed in the 13th century by the “greatest mathematician of the Middle Ages”, Leonardo Pisano Fibonacci. Each numeral in the series is found by adding together the two previous numbers, starting with zero and one. Since 0 + 1 = 1, the third number in the sequence is one. Then, because 1 + 1 = 2, the fourth number in the sequence is two. This pattern can be repeated an infinite number of times to create the Fibonacci sequence. Thus, the series looks like this:
- 0, 1, 1, 2, 3, 5, 8, 13, 21, 34, 55, 89, 144, 233, 377, 610, 987, 1597, etc…
This sequence of numbers is the foundation of The Golden Ratio, which is approximately 1.618. This ratio can be found by dividing any number in the sequence (with the exception of the first few numbers) by the previous number. This ratio can be seen all throughout nature, like in the spirals of seashells and galaxies and in the number of branches that can be found on a tree.
But what does this have to do with futures trading? In his recent NinjaTrader Ecosystem webinar Fibonacci Trading Strategy with Supply and Demand Levels, Pure Financial Academy founder and CEO Will Busby introduced the Fibonacci sequence and explained its role in analyzing the futures market. He said that “the Fibonacci number system was implemented into technical analysis to attempt forecasting the future of the market”.
Busby explained that if you take any number in the Fibonacci sequence and divide it by another, you can get an assortment of different ratios that can be used when analyzing the markets. For example, if you divide a Fibonacci number by the number directly to its right, you get about 62%. Dividing it by the number two spaces to its right will get you about 38%.
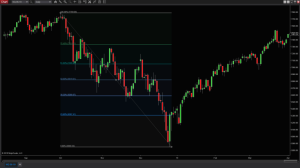
A trader can then designate any two points on a chart, perhaps a high and a low, as 0% and 100% and then plot these Fibonacci ratios into the space between. While there is still debate about whether or not these ratios actually have a role in market movement, many traders like to use them as tools for identifying potential support and resistance levels, and more.
In this short clip, Will Busby explains the origins and uses of the Fibonacci sequence in greater detail. If you are interested in learning more about how to use Fibonacci numbers in your own technical analysis, be sure to check out Busby’s full-length webinar.
If you enjoyed this clip, be sure to watch other market-analysis webinars from the NinjaTrader Ecosystem, like How to Improve Entries and Exits with Fibonacci in Any Market with Alla Peters of the Fibonacci Trading Institute and How to Trade with Fibonacci Price Relationships and Volume Delta with Karen Hagans of FibAnalysis.
You can check out the full library of free trading videos from the NinjaTrader Ecosystem, or head over to the upcoming webinars page to register for future live events!
Enter Email for Updates