Volume Delta: Advanced Indicator For Volume Analysis - by HelloWin.io
Cumulative Delta: Essential Tool for Evaluating Buying and Selling Pressure through Volume Delta - by HelloWin.io
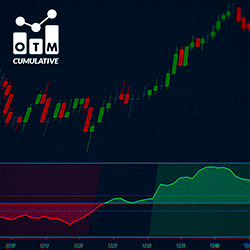
Cumulative Delta - by OTM Trading
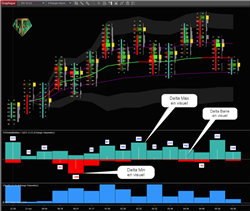
TDSDeltaMinMax - by TradeDevSystem
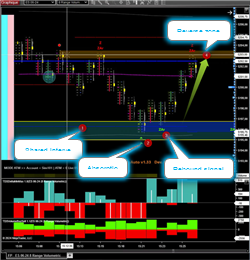
TDSDeltaAuto - by TradeDevSystem
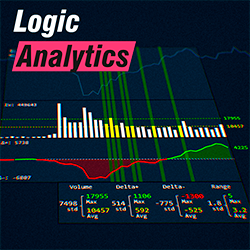
Volume Delta Analytics - by Logic Indicators
Q-BarNetDelta - by JohnQ Trading
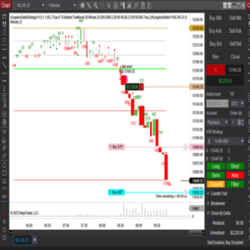
KyngdomDeltaV1 - by Kyngdom Trading LLC
Session Delta Pivot - by OrderFlow Labs