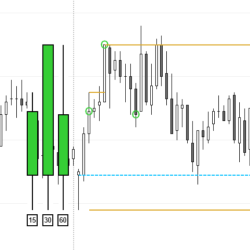
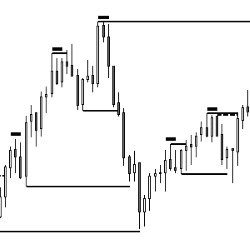
Price Action | Support and Resistance – Opening Range - by PriceActionIndicators.com
Price Action | Support and Resistance – Open Gaps - by PriceActionIndicators.com
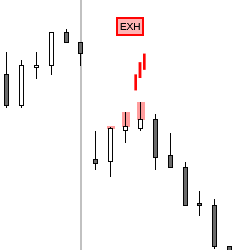
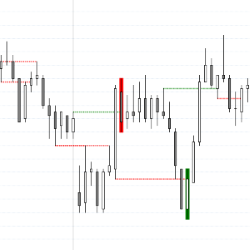
Price Action | Support and Resistance – Breakout Failure Tick - by PriceActionIndicators.com
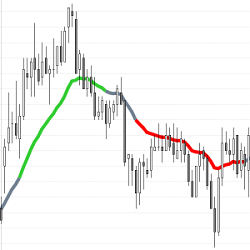
Price Action | Simple Always In EMA - by PriceActionIndicators.com
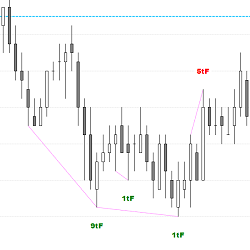
Price Action | Support and Resistance – Double Bottom / Double Top - by PriceActionIndicators.com
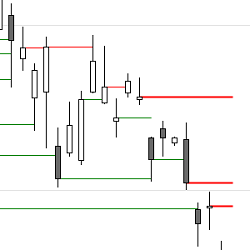
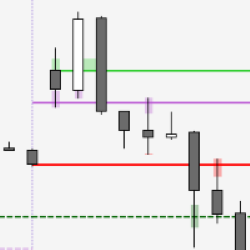
Price Action | Support and Resistance – Day Trading S/R Pro - by PriceActionIndicators.com
Price Action | Support and Resistance – Breakout Test - by PriceActionIndicators.com
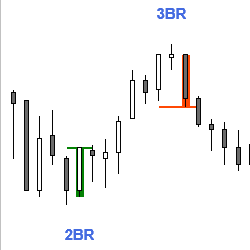
Price Action | Reversal Signal Bars - by PriceActionIndicators.com
Price Action | Buy Sell Pressure - by PriceActionIndicators.com