JIVE Isomorphic Volatility Engine - by J Auto Trading Strategies
Gamma Scalping Volatility Pro - by Tick Analytics LLC
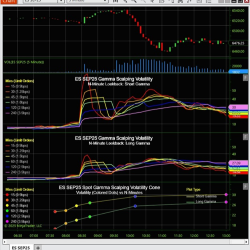
Gamma Scalping Realized Volatility - by Tick Analytics LLC

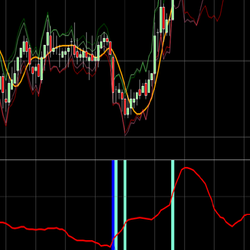
Dynamic Standard Deviations (Volatility, Deviation Bands, Support Resistance, Mean Reversion, Statistical Analysis, Price Targets, Multi-Timeframe, Probability Zones) - by Steady Turtle Trading


Solar Wave RK: Pro Trend Indicator for Renko Charts, Featuring Momentum and Volatility Assessment - by RenkoKings.com
Jurik Volatility Bands - by nt8Indicators

Volatility Quality Index - by nt8Indicators

Volatility Bands - by nt8Indicators

QW Volatility Indicator - by Quant-Wise