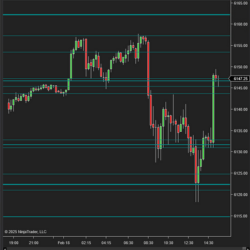
Magic Levels - by Bull Barbie
TradeNotifier - by J.A.O. Consulting

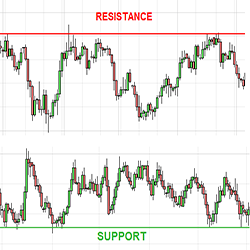
Support/Resistance Lines - by TREMPER.com
Volume Sliver - by TREMPER.com
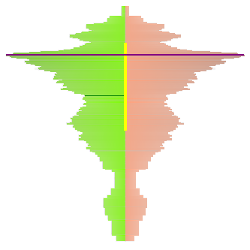
TC_BarProfiler - by TradingCoders
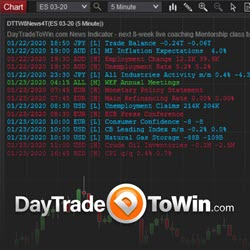
News Indicator - by DayTradeToWin.com
QWT Liquidity Index - by Quant-Wise

Chart Click Trader – Free Chart Trader for NinjaTrader 8 - by Mas Capital Global Limited

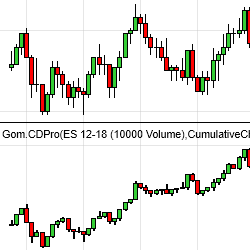
GomCD - by Gomicators
Advanced Risk Reward Indicator for NinjaTrader 8 - by Mas Capital Global Limited